The thanatorium is a speculative service for assisted suicide in Soylent Green. Suicide and death are not easy topics and I will do my best to address them seriously. Let me first take a moment to direct anyone who is considering or dealing with suicide to please stop reading this and talk to someone about it. I am unqualified to address—and this blog is not the place to work through—such issues.
There are four experiences to look at in the interface and service design of the Thanatorium: The patient, their beneficiaries, the usher to the beneficiaries, and the attendants to the patient. This post is about the attendants to the patient. Forewarning: This is the role we have the least information about. These Thanatorium personnel are there to assist the patient in their suicide, and deal with the body after the ceremony is complete.
The attendants have many goals and tasks to accomplish with each patient:
Help set the patient at ease so they complete the ceremony
Welcome the patient warmly
Assist them with tasks
Help them disrobe
Get them onto the gurney
Provide the hemlock
Set the patient in place for the cinerama experience
Press the gray buttons (which I interpret as ensuring medical monitoring, see below)
Set a liminal mood
Remove the clothes for donating and cup for cleaning
Leave the patient during the cinerama
Return to the body when the patient has passed
Usher the gurney through the portal
Nearly all of this is manual, with no speculative interfaces to speak of. A service design approach would look at this entire touchpoint, though. So, some quick notes.
Note their uniforms. Rather than the Guayabera shirt that the usher wears, the attendants wear vestments—white robes with goldenrod cuffs and cinctures around their waists. They even wear sandals to convey a sort of biblical, old-world holiness. It’s goofy and cheap, and kind of perfect.
Their manner is solemn, never speaking and performing their tasks with a sort of dance-like deliberateness. The behavior helps set off the space as liminal, somewhere not-quite like the world outside. No notes on the frontstage choreography.
The lighting begins a little flat, like overhead fluorescents in a school cafeteria. Maybe this is to give the patient a sense of certainty, of complete information about the room; but for my money the whole thing would seem more liminal with more dramatic lighting: A warm pool of light around the bed, maybe tiny amber incandescent bulbs flickering in a ring around the walls, like candles or stars.
Yes, closer to this.
There are some things we don’t get to see about the ceremony, like where the hemlock is stored and how it is presented to Sol, or how he gets up on a bed that’s above his waist, or what they do with his clothes. Or even—and this bit really bugs me—how the light changes from white to Sol’s requested orange at that moment. It’s not the usher, who is in the foyer about to intercept Thorn, and not the attendants, whose attention is on Sol. Maybe it’s on a timer, but that makes little sense. I really have to chalk it up to another movie-making error. Anyway, we’ll get to all this in the patient’s experience post, next.
For now let’s note that after the patient drinks the hemlock and they ease him back, we finally get to the one interface.
The ominous, inscrutable gray buttons…
Before departing the chamber, one of the attendants reaches down to a small metallic panel at the head of the bed. It consists of two square pushbuttons on the right, and a dial (or a plunger?) on the left.
The attendant presses and holds both of the buttons simultaneously for about three seconds. In the movie this attendant then gives the other a knowing glance, and they depart.
What the hell is this interface meant to be?
It’s quite unclear what state change this interface is meant to make, or why it needs to be a two-handed switch, when these sorts of things are mostly used for safety. My best guess is that since the drinking of the hemlock is the point of no return, and since the observation window is closed during that sequence so grief-stricken beneficiaries can’t interrupt; the two-handed switch is the silent signal from the attendants to the usher that everything is cool and they can open the observation window for final farewells. That’s low-confidence backworlding, though, since in the movie we know the usher is not present in the observation chamber at this time, but in the foyer of the thanatorium about to intercept Thorn. So, take this with a grain of salt.
But, if that’s the usual purpose, why have one panel with the two buttons? It’s a bit silly because they are close enough to be mashed by a single palm or even hip. It would make more sense if each attendant had their own button on each side of the bed, which they had to hold down. Have each button illuminate small green bulbs, and then jump-cut to the usher’s interface where two identical green bulbs labeled READY both illuminate. Then the usher can open the window and the beneficiary interface can switch to SPEAKING PERMITTED. This would make that weird interface moment make at least some sense.
Oh, and the dial? I have no idea. It’s unlabeled. Could be to control the bed height, or audio volume, or the brightness? Why one and not the other? There’s no way to tell and nothing makes a lot of sense given the rest of this scene. Provide your best guess in the comments, if you like. Otherwise my recommendation is to remove it.
Medical monitoring
One thing that seems to be missing the scene is some acknowledgment that the attendants are the ones to ensure that medical monitoring is operational, and do some troubleshooting if not. The monitoring is important, because the usher will await the clinical death signals before ending the cinerama and opening the observation window again for final viewing by the beneficiaries.
To help signal this, I recommend adding to the scene a quick shot of the surface of the bed before Sol lays down, showing inset silver disks, hinting at something like ECG electrodes, and then adding a panel at the head of the bed that an attendant can pull out to reveal the clinical death gauges described in the usher’s interface post.
These three, but with the dials in normal ranges for living patients.
The attendant can then close the panel, give the everything is in order look to the other, and the two of them depart for their break room, or jump seats, or watercooler; wherever they go for the interim.
This makes me realize the attendants just have to kind of hang out during the cinerama, and begs some sort of Rosencrantz and Guildenstern Are Dead philosophical dialog treatment. Please enter your drafts in the comments.
A final viewing
Once the patient passes, the attendants come in and push the gurney along its track into the portal. But this is for show, as the gurney is on a track, and after it leaves the theater to the “backstage,” it is pulled along by a mechanized track in the floor. So it could just be automated. But seeing the attendants moving it along gives the beneficiaries some last bit of theater that the body will be respectfully dealt with.
The thanatorium is a speculative device for assisted suicide in Soylent Green. Suicide and death are not easy topics and I will do my best to address them seriously. Let me first take a moment to direct anyone who is considering or dealing with suicide to please stop reading this and talk to someone about it. I am unqualified to address—and this blog is not the place to work through—such issues.
There are four experiences to look at in the interface and service design of the Thanatorium: The patient, their beneficiaries, the usher to the beneficiaries, and the attendants to the patient. This post is about the interface for the usher. This Thanatorium personnel is there as a stage manager of sorts, both to help the patient and the beneficiaries go where they need to go, ensure the beneficiaries do not do what they must not, and run the tech aspects of the ceremony.
The usher, left, ushing.
Note that—as I backworlded in the last post—these notes presume that the reason the beneficiaries are separated from the patients are to prevent them from trying to stop the event, and to minimize distractions during the cinerama display for gross biochemical reasons. Also recall that we’re having to go with a best-guess as to what the usual experience is, since we only see Thorn’s tardy thuggery in the film.
The usher’s tasks
Based on what we see in the film, the usher has a lot to do for each event…
Receive the patient’s preferences (music category, color, whatever other questions intake asked before we join that scene) from the intake personnel
Escort the patient to the “theater” and the beneficiaries to the observation room
Set the color of the light and the music to the patient’s preferences
Close the portal for the hemlock drinking
Open the portal for last farewells
Close the portal for the cinerama display
Start the cinerama display
Get help if the patient gets up or otherwise interrupts the ceremony
Wait for when the patient dies
Open the portal to view the body’s being shuttled away
Ensure the beneficiaries behave, answer any questions
Escort the beneficiaries back to the lobby
The interface barely touches on any of this
With all that in mind, we can see that this interface is woefully ill-equipped for any of his tasks. In the prior post I argue that the features for speaking to the patient—the speaker, the audio jack, and the SPEAKING PERMITTED indicator—should be separated from the usher’s stage manager functions. So we’re only going to pay attention in this post to the row of backlit rocker toggles labeled PORTAL, EFFECTS, CHAMBER 2, AUDIO, VISUAL, CHAMBER 1 and a little bit of the authorization key that looks like a square metal button in the screen cap above. And note I’m going to make suggestions that are appropriate to the early 1970s rather than use either modern real-world or speculative interface technologies.
First, that authorization key is pretty cool
The fact that it’s a featureless, long metal cuboid is so simple it feels sci-fi. Even the fact that its slot is unlabeled is good—it would help prevent a malicious or grief-panicked user from figuring out how to take control. You could even go one step further and have a hidden magnetic switch, so there’s not even a slot to clue in users. Production designer note, though, this means that the panel needs to be wood (or something non-magnetic) rather than a ferromagnetic metal. Aluminum, maybe, since it’s paramagnetic, but you also don’t want anything that can scratch or wear easily and give away the position of the secret spot.
This is a cabinet lock, but the same principle would apply.
But, the buttons don’t match the scene
The PORTAL button never changes state, though we see the portal open and close in the scene. AUDIO is dim though we hear the audio. Maybe dim equals on? No, because VISUAL is lit. There’s some gymnastics we could do to apologize for this, but Imma give up and just say it’s just a moviemaking error.
And they are poorly clustered
Why is CHAMBER 2 before CHAMBER 1? Why are the three AV buttons split up by CHAMBER 2? A more reasonable chunking of these would be PORTAL on its own, CHAMBER 1 & CHAMBER 2 together, and the remaining A/V buttons together. These groups should be separated to make them easier to identify and help avoid accidental activation (though the stakes here are pretty low.)
If we were just dealing with these 6 buttons, this might be a reasonable clustering. But, read on…
The PORTAL button is the wrong type and orientation
Look close at the screen shot and you’ll see that each button consists of three parts. A white, back-lit square which bears the label, and two black pushbuttons that act like rocker switches. That is, press the upper one in, and the lower one pops out. Press that popped-out lower one in, and the upper one pops out again. When the lower button is pressed in, the button is “on,” which you can tell because those are the only ones with the upper button popped out and the back light illuminated.
Rocker switches are good for things with two mutually exclusive states, like ON and OFF. The PORTAL button is the only one for which this makes unambiguous sense, with its two states being OPEN and CLOSED. But, we have to note that it is poorly mapped. The button has a vertical orientation, but the portal closes from right to left. It means the usher has to memorize which toggle state is open and which one is closed. It would more usable to have an inferrable affordance. Cheapest would be to turn the button sideways so it maps more clearly, but an even tighter mapping would be a slider mounted sideways with OPEN and CLOSED labels. I don’t think the backlit status indicator is necessary here because there’s already a giant signal of the state of the portal, and that’s the adjacent portal.
What do EFFECTS and CHAMBER even do?
What does the EFFECTS button do? I mean, if AUDIO and VISUAL have their own controls, what’s left? Lasers? A smoke machine? Happiness pheromones? (I’m getting The Cabin in the Woods vibes here.) Whatever it is, if there are multiple, they should have individual controls, in case the patient wants one but not the other, or if there’s any variability that needs controlling.
Also what do CHAMBER 1 and CHAMBER 2 do? It’s very poor labeling. What chambers do they refer to? Maybe the observation room is chamber 1 and the theater is chamber 2? If so, different names could save the usher’s having to memorize them. Also, what do these switches control? Lights? Door locks? We would need to know to really make design recommendations for these.
The AV controls are incomplete
Which takes us to AUDIO, and VISUAL. Each of these is missing something.
Sure, they might need ON/OFF controls as we see here. But how about a volume control to accommodate the hard-of-hearing and the sound-sensitive? How about a brightness control for the video? These could have an OFF state and replace the toggle switches.
We know from the movie itself that the service has offered Sol his choice of music genre. Where is the genre selector? This is a non-trivial problem since the number of genres is on the order of 1000. They probably don’t offer all of them, but at intake they do ask Sol his preference as an open-ended question, so it implies a huge selection. Radio band selectors would have made sense to audiences in the 1970s, and signal a huge number of options, but risk being “out of tune” and imply that it’s broadcast. So either have a small number of options with a 15° rotary switch (and rewrite the intake scene so Sol selects from a menu) or three 10-digit rotary switches with a “commit” momentary button, and have a small reference booklet hanging there.
I also want to believe that the theme of the video can be selected. Sol has chosen “nature” but you could imagine patients requesting for their end-of-life ceremony something else like “family,” “celestial,” “food” (given the diegesis, this should be first) or even “religious” (with a different one for each of the world’s twelve major religions). So it would make sense to have a video theme selector as well, say, on the order of 20 options. That could be a 15° rotary switch. Labeling gets tough, but it could just be numbers with an index label to the side.
I’m going to presume that they never need scrubbing controls (REWIND or FAST FORWARD) for the AV. The cinerama plays through once and stops. Sudden rewinding or fast forwarding would be jarring for the patient and ruin the immersion. Have a play button that remains depressed while the cinerama is ongoing. But if the patient passes more quickly than expected, a RESET button would make sense. So would a clock or a countdown timer, since Sol had confirmed at intake that it would be at least 20 minutes, and to let the usher know how much time they have left to get those neurotransmitter numbers up up up.
Some controls are straight up missing
How does an usher set the lights according to the patient’s preferences? They ask at intake, and we see Sol’s face washed with a soothing amber color once the attendants leave, so there should be a color selector. Three RGB slide potentiometers would provide perfect control, but I doubt anyone would quibble that the green they’d asked for was #009440 and not #96b300, so you could go with a selector. The XKCD color survey results show that there are on the order of about 30 colors, so something similar to the video-theme selector above would work, with a brightness potentiometer to the side.
The patient experience is a bit of a show, so to signal its beginning and end, there should be lighting controls for the usher to dim and raise the lights, like in a theater. So let’s add those.
Also, the usher has a minor medical task to accomplish: Monitoring the health of the patient to know when they’ve passed. The three metrics for clinical death are a cessation of all three of…
breath
blood flow
brain activity
…so there should be indicators for each of these. As discussed in the medical chapter of the book, this is ideally a display of values over time, but in the resource-poor and elecromechanical world of Soylent Green, it might have to be a collection of gauges, with an indicator bulb near the zero for when activity has stopped. A final, larger indicator bulb should light when all three gauges are still. To really underscore the morbidness of this interface, all those indicators should be green.
If you buy my backworlding, i.e. that part of the point of preventing interruptions is to maximize the dopamine and serotonin being released into the patient’s body, there should also be status indicators showing the level of these neurotransmitters in the patient’s bloodstream. They can be the same style of gauges, but I’d add a hand drawn arrow to some point along the chapter ring that reads “quota.” Those indicators should be larger than the clinical death indicators to match their importance to Soylent’s purposes.
Lastly, thinking of Thorn’s attack, the usher should have a panic button to summon help if the patient or the beneficiaries are getting violent (especially once they discover they’re locked in.) This should be hidden under the panel so it can be depressed secretly.
Where should this panel go?
As described in the beneficiaries post we’re going to leave the communication interface just below the portal, where they are now for those fleeting moments when they can wish the patient goodbye.
And there’s no need to put the usher’s controls under the nose of the beneficiaries. (In fact with the medical monitoring it would be kind of cruel.) So let the usher have a lectern beside the door, in a dim pool of light, and mount the controls to the reading top. (Also give them a stool to rest on, have we learned nothing?) Turn the lectern such that the interface is not visible to beneficiaries in the room. This lets the usher remain respectfully out of the center of attention, but in a place where they can keep an eye on both the patient when the portal is open, and the beneficiaries throughout.
Looks cheap? Perfect.
In total, the lectern panel would look something like this…
The Usher escorts Thorn into the room. Thorn rushes to the portal. The usher steps behind a lectern near the door.
Usher
It’s truly a shame you missed the overture.
The Usher slides a switch on the lectern panel, and the portal closes.
Thorn
I want to see him.
Usher, looking down at his interface
That is prohibited during the ceremony.
Worm’s eye view. Thorn takes a few steps toward him and knocks the lectern to the ground. It falls with its interface in the foreground. In the background, we see Thorn slam the usher against the wall.
Thorn
Well I can assure you, open that damned thing right now, or I swear to God you’ll die before he does!
Usher
OK, OK!
The usher falls to his hands and knees and we see him slide the switch to open the portal. Thorn steps back to it, and the usher gets on his feet to right the lectern
When Agent Ross is shot in the back during Klaue’s escape from the Busan field office, T’Challa stuffs a kimoyo bead into the wound to staunch the bleeding, but the wounds are still serious enough that the team must bring him back to Wakanda for healing. They float him to Shuri’s lab on a hover-stretcher.
Here Shuri gets to say the juicy line, “Great. Another white boy for us to fix. This is going to be fun.”Sorry about the blurry screen shot, but this is the most complete view of the bay.
The hover-stretcher gets locked into place inside a bay. The bay is a small room in the center of Shuri’s lab, open on two sides. The walls are covered in a gray pattern suggesting a honeycomb. A bas-relief volumetric projection displays some medical information about the patient like vital signs and a subtle fundus image of the optic nerve.
Shuri holds her hand flat and raises it above the patient’s chest. A volumetric display of 9 of his thoracic vertebrae rises up in response. One of the vertebrae is highlighted in a bright red. A section of the wall display displays the same information in 2D, cyan with orange highlights. That display section slides out from the wall to draw observer’s attentions. Hexagonal tiles flip behind the display for some reason, but produce no change in the display.
Shuri reaches her hands up to the volumetric vertebrae, pinches her forefingers and thumbs together, and pull them apart. In response, the space between the vertebrae expands, allowing her to see the top and bottom of the body of the vertebra.
She then turns to the wall display, and reading something there, tells the others that he’ll live. Her attention is pulled away with the arrival of Wakabe, bringing news of Killmonger. We do not see her initiate a treatment in the scene. We have to presume that she did it between cuts. (There would have to be a LOT of confidence in an AI’s ability to diagnose and determine treatment before they would let Griot do that without human input.)
We’ll look more closely at the hover-stretcher display in a moment, but for now let’s pause and talk about the displays and the interaction of this beat.
A lab is not a recovery room
This doesn’t feel like a smart environment to hold a patient. We can bypass a lot of the usual hospital concerns of sterilization (it’s a clean room) or readily-available equipment (since they are surrounded by programmable vibranium dust controlled by an AGI) or even risk of contamination (something something AI). I’m mostly thinking about the patient having an environment that promotes healing: Natural light, quiet or soothing music, plants, furnishing, and serene interiors. Having him there certainly means that Shuri’s team can keep an eye on him, and provide some noise that may act as a stimulus, but don’t they have actual hospital rooms in Wakanda?
Why does she need to lift it?
The VP starts in his chest, but why? If it had started out as a “translucent skin” illusion, like we saw in Lost in Space (1998, see below), then that might make sense. She would want to lift it to see it in isolation from the distracting details of the body. But it doesn’t start this way, it starts embedded within him?!
The “translucent skin” display from Lost in Space (1998)
It’s a good idea to have a representation close to the referent, to make for easy comparison between them. But to start the VP within his opaque chest just doesn’t make sense.
This is probably the wrong gesture
In the gestural interfaces chapter of Make It So, I described a pidgin that has been emerging in sci-fi which consisted of 7 “words.” The last of these is “Pinch and Spread to Scale.” Now, there is nothing sacred about this gestural language, but it has echoes in the real world as well. For one example, Google’s VR painting app Tilt Brush uses “spread to scale.” So as an increasingly common norm, it should only be violated with good reason. In Black Panther, Shuri uses spread to mean “spread these out,” even though she starts the gesture near the center of the display and pulls out at a 45° angle. This speaks much more to scaling than to spreading. It’s a mismatch and I can’t see a good reason for it. Even if it’s “what works for her,” gestural idiolects hinder communities of practice, and so should be avoided.
Better would have been pinching on one end of the spine and hooking her other index finger to spread it apart without scaling. The pinch is quite literal for “hold” and the hook quite literal for “pull.” This would let scale be scale, and “hook-pull” to mean “spread components along an axis.”
If we were stuck with the footage of Shuri doing the scale gesture, then it would have made more sense to scale the display, and fade the white vertebrae away so she could focus on the enlarged, damaged one. She could then turn it with her hand to any arbitrary orientation to examine it.
An object highlight is insufficient
It’s quite helpful for an interface that can detect anomalies to help focus a user’s attention there. The red highlight for the damaged vertebrae certainly helps draw attention. Where’s the problem? Ah, yes. There’s the problem. But it’s more helpful for the healthcare worker to know the nature of the damage, what the diagnosis is, to monitor the performance of the related systems, and to know how the intervention is going. (I covered these in the medical interfaces chapter of Make It So, if you want to read more.) So yes, we can see which vertebra is damaged, but what is the nature of that damage? A slipped disc should look different than a bone spur, which should look different than one that’s been cracked or shattered from a bullet. The thing-red display helps for an instant read in the scene, but fails on close inspection and would be insufficient in the real world.
This is not directly relevant to the critique, but interesting that spinal VPs have been around since 1992. Star Trek: The Next Generation, “Ethics” (Season 5, Episode 16).
Put critical information near the user’s locus of attention
Why does Shuri have to turn and look at the wall display at all? Why not augment the volumetric projection with the data that she needs? You might worry that it could obscure the patient (and thereby hinder direct observations) but with an AGI running the show, it could easily position those elements to not occlude her view.
Compare this display, which puts a waveform directly adjacent to the brain VP. Firefly, “Ariel” (Episode 9, 2002).
Note that Shuri is not the only person in the room interested in knowing the state of things, so a wall display isn’t bad, but it shouldn’t be the only augmentation.
Lastly, why does she need to tell the others that Ross will live? if there was signifcant risk of his death, there should be unavoidable environmental signals. Klaxons or medical alerts. So unless we are to believe T’Challa has never encountered a single medical emergency before (even in media), this is a strange thing for her to have to say. Of course we understand she’s really telling us in the audience that we don’t need to wonder about this plot development any more, but it would be better, diegetically, if she had confirmed the time-to-heal, like, “He should be fine in a few hours.”
Alternatively, it would be hilarious turnabout if the AI Griot had simply not been “trained” on data that included white people, and “could not see him,” which is why she had to manually manage the diagnosis and intervention, but that would have massive impact on the remote piloting and other scenes, so isn’t worth it. Probably.
Thoughts toward a redesign
So, all told, this interface and interaction could be much better fit-to-purpose. Clarify the gestural language. Lose the pointless flipping hexagons. Simplify the wall display for observers to show vitals, diagnosis and intervention, as well as progress toward the goal. Augment the physician’s projection with detailed, contextual data. And though I didn’t mention it above, of course the bone isn’t the only thing damaged, so show some of the other damaged tissues, and some flowing, glowing patterns to show where healing is being done along with a predicted time-to-completion.
Stretcher display
Later, when Ross is fully healed and wakes up, we see a shot of of the med table from above. Lots of cyan and orange, and *typography shudder* stacked type. Orange outlines seem to indicate controls, tough they bear symbols rather than full labels, which we know is better for learnability and infrequent reuse. (Linguist nerds: Yes, Wakandan is alphabetic rather than logographic.)
These feel mostly like FUIgetry, with the exception of a subtle respiration monitor on Ross’ left. But it shows current state rather than tracked over time, so still isn’t as helpful as it could be.
Then when Ross lifts his head, the hexagons begin to flip over, disabling the display. What? Does this thing only work when the patient’s head is in the exact right space? What happens when they’re coughing, or convulsing? Wouldn’t a healthcare worker still be interested in the last-recorded state of things? This “instant-off” makes no sense. Better would have been just to let the displays fade to a gray to indicate that it is no longer live data, and to have delayed the fade until he’s actually sitting up.
All told, the Wakandan medical interfaces are the worst of the ones seen in the film. Lovely, and good for quick narrative hit, but bad models for real-world design, or even close inspection within the world of Wakanda.
MLK Day Matters
Each post in the Black Panther review is followed by actions that you can take to support black lives.
Today is Martin Luther King Day. Normally there would be huge gatherings and public speeches about his legacy and the current state of civil rights. But the pandemic is still raging, and with the Capitol in Washington, D.C. having seen just last week an armed insurrection by supporters of outgoing and pouty loser Donald Trump, (in case that WP article hasn’t been moved yet, here’s the post under its watered-down title) worries about additional racist terrorism and violence.
So today we celebrate virtually, by staying at home, re-experiening his speeches and letters, and listening to the words of black leaders and prominent thinkers all around us, reminding us of the arc of the moral universe, and all the work it takes to bend it toward justice.
As we reflect on the contributions of Dr. King, let us build on his legacy by securing the promise of justice for all.
By ensuring our voices were heard in the streets and at the ballot box, we renewed our fight to make the dream a reality. But the work continues. #MLKDay
— The Martin Luther King, Jr. Center (@TheKingCenter) January 18, 2021
With the Biden team taking the reins on Wednesday, and Kamala Harris as our first female Vice President of color, things are looking brighter than they have in 4 long, terrible years. But Trump would have gotten nowhere if there hadn’t been a voting block and party willing to indulge his racist fascism. There’s still much more to do to dismantle systemic racism in the country and around the world. Let’s read, reflect, and use whatever platforms and resources we are privileged to have, act.
So while the world is in the grip of the novel COVID-19 coronavirus pandemic, I’ve been thinking about those fictional user interfaces that appear in pandemic movies that project how quickly the infectious-agent-in-question will spread. The COVID-19 pandemic is a very serious situation. Most smart people are sheltering in place to prevent an overwhelmed health care system and finding themselves with some newly idle cycles (or if you’re a parent like me, a lot fewer idle cycles). Looking at this topic through the lens of sci-fi is not to minimize what’s happening around us as trivial, but to process the craziness of it all through this channel that I’ve got on hand. I did it for fascism, I’ll do it for this. Maybe this can inform some smart speculative design.
Caveat #1:As a public service I have included some information about COVID-19 in the body of the post with a link to sources. These are called out the way this paragraph is, with a SARS-CoV-2 illustration floated on the left. I have done as much due diligence as one blogger can do to not spread disinformation, but keep in mind that our understanding of this disease and the context are changing rapidly. By the time you read this, facts may have changed. Follow links to sources to get the latest information. Do not rely solely on this post as a source. If you are reading this from the relative comfort of the future after COVID-19, feel free to skip these.
Get on a boat, Hongkongers, you can’t even run for the hills! Contagion (2011)
And yes, this is less of my normal fare of sci-fi and more bio-fi, but it’s still clearly a fictional user interface, so between that and the world going pear-shaped, it fits well enough. I’ll get back to Blade Runner soon enough. I hope.
Giving credit where it’s due: All but one of the examples in this post were found via the TV tropes page for Spreading Disaster Map Graphic page, under live-action film examples. I’m sure I’ve missed some. If you know of others, please mention it in the comments.
Four that are extradiegetic and illustrative
This first set of pandemic maps are extradiegetic.
Vocabulary sidebar: I use that term a lot on this blog, but if you’re new here or new to literary criticism, it bears explanation. Diegesis is used to mean “the world of the story,” as the world in which the story takes place is often distinct from our own. We distinguish things as diegetic and extradiegetic to describe when they occur within the world of the story, or outside of it, respectively. My favorite example is when we see a character in a movie walking down a hallway looking for a killer, and we hear screechy violins that raise the tension. When we hear those violins, we don’t imagine that there is someone in the house who happens to be practicing their creepy violin. We understand that this is extradiegetic music, something put there to give us a clue about how the scene is meant to feel.
So, like those violins, these first examples aren’t something that someone in the story is looking at. (Claude Paré? Who the eff is—Johnson! Get engineering! Why are random names popping up over my pandemic map?) They’re something the film is doing for us in the audience.
The Killer that Stalked New York (1950) is a short about a smallpox infection of New York City.
Edge of Tomorrow (2014) has this bit showing the Mimics, spreading their way across Europe.
The end of Rise of the Planet of the Apes (2011) shows the fictional virus ALZ-113 spreading.
The beginning of Dawn of the Planet of the Apes (2014) repeats the fictional virus ALZ-113 spreading, but augments it with video overlays.
There’s not much I feel the need to say about these kinds of maps, as they are a motion graphic and animation style. I note at least two use aposematic signals in their color palette and shapes, but that’s just because it helps reinforce for the audience that whatever is being shown here is a major threat to human life. But I have much more authoritative things to say about systems that are meant to be used.
Before we move on, here’s a bonus set of extradiegetic spreading-pathogen maps I saw while watching the Netflix docuseries Pandemic: How to Prevent an Outbreak, as background info for this post.
The five examples in this section are spread throughout the text for visual interest, but presented in chronological order. They are The Andromeda Strain (1977), Outbreak (1995), Evolution (2001), Contagion (2011), and World War Z (2013). I highly recommend Contagion for the acting, movie making, the modeling, and some of the facts it conveys. For instance, I think it’s the only film that discusses fomites. Everyone should know about fomites.
Since I raise their specter: As of publication of this post the CDC stated that fomites are not thought to be the main way the COVID-19 novel coronavirus spreads, but there are recent and conflicting studies. The scientific community is still trying to figure this out. The CDC says for certain it spreads primarily through sneezes, coughs, and being in close proximity to an infected person, whether or not they are showing symptoms.
Note that these five spreading pathogen examples are things that characters are seeing in the diegesis, that is, in the context of the story. These interfaces are meant to convey useful information to the characters as well as us in the audience.
Which is as damning a setup as I can imagine for this first example from The Andromeda Strain (1971). Because as much as I like this movie, WTF is this supposed to be? “601” is explained in the dialogue as the “overflow error” of this computer, but the pop-art seizure graphics? C’mon. There’s no way to apologize for this monstrosity.
This psychedelic nonsense somehow tells the bunkered scientists about how fast the eponymous Andromeda Strain will spread. (1971) Somehow the CRT gets nervous, too.
I’m sorry that you’ll never get those 24 seconds back. But at least we can now move on to look at the others, which we can break down into the simple case of persuasion, and the more complex case of use.
The simple case
In the simplest case, these graphics are shown to persuade an authority to act. That’s what happening in this clip from Outbreak (1995).
General Donald McClintock delivers a terrifying White House Chief-of-Staff Briefing about the Motaba virus. Outbreak (1995)
But if the goal is to persuade one course of action over another, some comparison should be made between two options, like, say, what happens if action is taken sooner rather than later. While that is handled in the dialogue of many of these films—and it may be more effective for in-person persuasion—I can’t help but think it would be reinforcing to have it as part of the image itself. Yet none of our examples do this.
Compare the “flatten the curve” graphics that have been going around. They provide a visual comparison between two options and make it very plain which is the right one to pick. One that stays in the mind of the observer even after they see it. This is one I’ve synthesized and tweaked from other sources.
This is a conceptual diagram, not a chart. The capacity bar is terrifyingly lower on actual charts. Stay home as much as you can. Special shouts out to Larry West.
There is a diegetic possibility, i.e., that no one amidst the panic of the epidemic has the time to thoughtfully do more than spit out the data and handle the rest with conversation. But we shouldn’t leave it at that, because there’s not much for us to learn there.
More complex case
The harder problem is when these displays are for people who need to understand the nature of the threat and determine the best course of action, and now we need to talk about epidemiology.
Caveat #2:I am not an epidemiologist. They are all really occupied for the foreseeable future, so I’m not even going to reach out and bother one of them to ask their opinions on this post. Like I said before about COVID-19, I really hope you don’t come to sci-fi interfaces to become an expert in epidemiology. And, since I’m just Some Guy on the Internet Who Has Read Some Stuff on the Internet, you should take whatever you learn here with a grain of salt. If I get something wrong, please let me know. Here are my major sources:
Kate Winslet, playing epidemiologist Dr. Erin Mears in Contagion (2011), is probably more qualified than me. Hey, Kate: Call me. I have questions.
Caveat #3: To discuss using technology in our species’ pursuit of an effective global immune system is to tread into some uncomfortable territory. Because of the way disease works, it is not enough to surveil the infected. We must always surveil the entire population, healthy or not, for signs of a pathogen outbreak, so responses can be as swift and certain as possible. We may need to surveil certain at-risk or risk-taking populations quite closely, as potential superspreaders. Otherwise we risk getting…well…*gestures vaguely at the USA*. I am pro-privacy, so know that when I speak about health surveillance in this post, I presume that we are simultaneously trying to protect as much “other” privacy as we can, maybe by tracking less-abusable, less-personally identifiable signals. I don’t pretend this is a trivial task, and I suspect the problem is more wicked than merely difficult to execute. But health surveillance must happen, and for this reason I will speak of it as a good thing in this context.
Epidemiology is a large field of study, so for purposes of this post, we’re talking about someone who studies disease at the level of the population, rather than individual cases. Fictional epidemiologists appear when there is an epidemic or pandemic in the plot, and so are concerned with two questions: What are we dealing with? and What do we need to do?
Part 1: What are we dealing with?
Our response should change for different types of threat. So it’s important for an epidemiologist to understand the nature of a pathogen. There are a few scenes in Contagion where we see scientists studying a screen with gene sequences and a protein-folding diagram, and this touches on understanding the nature of the virus. But this is a virologists view, and doesn’t touch on most of what an epidemiologist is ultimately hoping to build first, and that’s a case definition. It is unlikely to appear in a spreading pathogen map, but it should inform one. So even if your pathogen is fictional, you ought to understand what one is.
“We’ve sequenced the virus and determined its origin, and we’ve modeled the way it edges the cells of the lung and the brain…” —Dr. Hextall, Contagion (2011)
A case definition is the standard shared definition of what a pathogen is; how a real, live human case is classified as belonging to an epidemic or not. Some case definitions are built for non-emergency cases, like for influenza. The flu is practically a companion to humanity, i.e., with us all the time, and mutates, so its base definition for health surveillance can be a little vague. But for the epidemics and pandemics that are in sci-fi, they are building a case definitionfor outbreak investigations. These are for a pathogen in a particular time and place, and act as a standard for determining whether or not a given person is counted as a case for the purposes of studying the event.
Case definition for outbreak investigations
The CDC lists the following as the components of a case definition.
Clinical criteria
Clinical description
Confirmatory laboratory tests
These can be pages long, with descriptions of recommended specimen collections, transportation protocols, and reporting details.
Combinations of symptoms (subjective complaints)
Signs (objective physical findings)
Source
(Sometimes) Specifics of time and place.
There are sometimes different case definitions based on the combination of factors. COVID-19 case definitions with the World Health Organization, for instance, are broken down between suspect, probable, and confirmed. A person showing all the symptoms and who has been in an area where an infected person was would be suspect. A person whose laboratory results confirmed the presence of SARS-CoV-2 is confirmed. Notably for a map, these three levels might warrant three levels of color.
As an example, here is the CDC case definition for ebola, as of 09 JUL 2019.
n.b. Case definitions are unlikely to work on screen
Though the case definition is critical to epidemiology, and may help the designer create the spreading pathogen map (see the note about three levels of color, above), but the thing itself is too text-heavy to be of much use for a sci-fi interface, which rely much more on visuals. Better might be the name or an identifying UUID to the definition. WHO case references look like this: WHO/COVID-19/laboratory/2020.5 I do not believe the CDC has any kind of UUID for its case definitions.
While case definitions don’t work on screen, counts and rates do. See below under Surveil Public Health for more on counts and rates.
Disease timeline
Infectious disease follows a fairly standard order of events, depicted in the graphic below. Understanding this typical timeline of events helps you understand four key metrics for a given pathogen: chains of transmission, R0, SI, and CFR.
For each of the key metrics, I’ll list ranges and variabilities where appropriate. These are observed attributes in the real world, but an author creating a fictional pathogen, or a sci-fi interfaces maker needing to illustrate them, may need to know what those numbers look like and how they tend to behave over time so they can craft these attributes.
Chains of Transmission
What connects the individual cases in an epidemic are the methods of transmission. The CDC lists the following as the basics of transmission.
Reservoir: where the pathogen is collected. This could be the human body, or a colony of infected mynocks, a zombie, or a moldy Ameglian Major flank steak forgotten in a fridge. Or your lungs.
Portal of exit, or how the pathogen leaves the reservoir. Say, the open wound of a zombie, or an innocent recommendation, or an uncovered cough.
Mode of transmission tells how the pathogen gets from the portal of exit to the portal of entry. Real-world examples include mosquitos, fomites (you remember fomites from the beginning of this post, don’t you?), sex, or respiratory particles.
Portal of entry, how the pathogen infects a new host. Did you inhale that invisible cough droplet? Did you touch that light saber and then touch your gills? Now it’s in you like midichlorians.
Susceptible host is someone more likely than not to get the disease.
A map of this chain of transmission would be a fine secondary-screen to a spreading pathogen map, illustrating how the pathogen is transmitted. After all, this will inform the containment strategies.
Variability: Once the chain of transmission is known, it would only change if the pathogen mutated.
Basic Rate of Reproduction = How contagious it is
A famous number that’s associated with contagiousness is the basic reproduction rate. If you saw Contagion you’ll recall this is written as R0, and pronounced “R-naught.” It describes, on average, how many people an infected person will infect before they stop being infectious.
If R0 is below 1, an infected person is unlikely to infect another person, and the pathogen will quickly die out.
If R0 is 1, an infected person is likely to infect one other, and the disease will continue through a population at a steady rate without intervention.
If R0 is higher than 1, a pathogen stands to explode through a population.
The CDC book tells me that R0 describes how the pathogen would reproduce through the population with no intervention, but other sources talk of lowering the R0 so I’m not certain if those other sources are using it less formally, or if my understanding is wrong. For now I’ll go with the CDC, and talk about R0 as a thing that is fixed.
It, too, is not an easy thing to calculate. It can depend on the duration of contagiousness after a person becomes infected, or the likelihood of infection for each contact between a susceptible person and an infectious person or vector, and the contact rate.
Variability: It can change over time. When a novel pathogen first emerges, the data is too sparse and epidemiologists are scrambling to do the field work to confirm cases. As more data comes in and numbers get larger, the number will converge toward what will be its final number.
It can also differ based on geography, culture, geopolitical boundaries, and the season, but the literature (such as I’ve read) refers to R0 as a single number.
Range: The range of R0 >1 can be as high as 12–18, but measles morbillivirus is an infectious outlier. Average range of R0, not including measles, of this sample is 2.5–5.2. MEV-1 from Contagion has a major dramatic moment when it mutates and its predicted R0 becomes 4, making it roughly as contagious as the now-eradicated killer smallpox.
Serial interval is the average time between successive cases in a chain of transmission. This tells the epidemiologist how fast a pathogen stands to spread through a population.
Variability: Like the other numbers, SI is calculated and updated with new cases while an epidemic is underway, but tend to converge toward a number. SI for some respiratory diseases is charted below. Influenza A moves very fast. Pertussis is much slower.
Range: As you can see in the chart, SI can be as fast as 2.2 days, or as slow as 22.8 days. The median in this set is 14 days and the average is 12.8. SARS-CoV-2 is currently estimated to be about 4 days, which is very fast.
The case fatality rate is a percentage that any given case will prove fatal. It is very often shortened to CFR. This is not always easy to calculate.
Variability: Early in a pandemic it might be quite low because hospital treatment is still available. Later in a pandemic, as hospital and emergency rooms are packed full, the CFR might raise quite high. Until a pathogen is eradicated, the precise CFR is changing with each new case. Updates can occur daily, or in real time with reports. In a sci-fi world, it could update real time directly from ubiquitous sensors, and perhaps predicted by a specialty A.I. or precognitive character.
Range: Case fatality rates range from the incurable, like kuru, at 100%. to 0.001% for chickenpox affecting unvaccinated children. The CFR changes greatly at the start of a pandemic and slowly converges towards its final number.
So, if the spreading pathogen map is meant to convey to an epidemiologist the nature of the pathogen, it should display these four factors:
Mode of Transmission: How it spreads
R0: How contagious it is
SI: How fast it spreads
CFR: How deadly it is
Part 2: What do we do?
An epidemiologist during an outbreak has a number of important responsibilities beyond understanding the nature of the pathogen. I’ve taken a crack at listing those below. Note: this list is my interpretation of the CDC materials, rather than their list. As always, offer corrections in comments.
Surveil the current state of things
Prevent further infections
Communicate recommendations
Epidemiology has other non-outbreak functions, but those routine, non-emergency responsibilities rarely make it to cinema. And since “communicate recommendations” is pretty covered under “The Simple Case,” above, the rest of this post will be dedicated to health surveillance and prevention tools.
Surveil the current state of things
In movies the current state of things is often communicated via the spreading pathogen map in some command and control center. The key information on these maps are counts and rates.
Counts and Rates
The case definition (above) helps field epidemiologists know which cases to consider in the data set for a given outbreak. They routinely submit reports of their cases to central authorities like the CDC or WHO, who aggregate them into counts, which are tallies of known cases. (And though official sources in the real world are rightly cautious to do it, sci-fi could also include an additional layer of suspected or projected cases.) Counts, especially over time, are important for tracking the spread of a virus. Most movie goers have basic numeracy, so red number going up = bad is an easy read for an audience.
Counts can be broken down into many variables. Geopolitical regions make sense as governmental policies and cultural beliefs can make meaningful distinctions in how a pathogen spreads. In sci-fi a speculative pathogen might warrant different breakdowns, like frequency of teleportation, or time spent in FTL warp fields, or genetic distance from the all-mother.
In the screen cap of the John Hopkins COVID-19 tracker, you can see counts high in the visual hierarchy for total confirmed (in red), total deaths (in white), and total recovered (in green). The map plots current status of the counts.
Rates is another number that epidemiologists are interested in, to help normalize the spread of a pathogen for different group sizes. (Colloquially, rate often implies change over time, but in the field of epidemiology, it is a static per capita measurement of a point in time.) For example, 100 cases is around a 0.00001% rate in China, with its population of 1.386 billion, but it would be a full 10% rate of Vatican City, so count can be a poor comparison to understand how much of a given population is affected. By representing the rates alongside the counts you can detect if it’s affecting a subgroup of the global population more or less than others of its kind, which may warrant investigation into causes, or provide a grim lesson to those who take the threat lightly.
Counts and rates over time
The trend line in the bottom right of the Johns Hopkins dashboard helps understand how the counts of cases are going over time, and might be quite useful for helping telegraph the state of the pandemic to an audience, though having it tucked in a corner and in orange may not draw attention as it needs to for instant-understanding.
These two displays show different data, and one is more cinegenic than the other. Confirmed cases, on the left, is a total, and at best will only ever level off. If you know what you’re looking at, you know that older cases represented by the graph are…uh…resolved (i.e. recovery, disability, or death) and that a level-off is the thing we want to see there. But the chart on the right plots the daily increase, and will look something like a bell curve when the pandemic comes to an end. That is a more immediate read (bad thing was increasing, bad thing peaked, bad thing is on the decline) and so I think is better for cinema.
At a glance you can also tell that China appears to have its shit sorted. [Obviously this is an old screen grab.]
In the totals, sparklines would additionally help a viewer know whether things are getting better or getting worse in the individual geos, and would help sell the data via small multiples on a close-up.
Plotting cases on maps
Counts and rates are mostly tables of numbers with a few visualizations. The most cinegenic thing you can show are cases on geopolitical maps. All of the examples, except the trainwreck that is The Andromedia Strain pathogen map, show this, even the extradiegetic ones. Real-world pathogens mostly spread through physical means, so physical counts of areas help you understand where the confirmed cases are.
Which projection?
But as we all remember from that one West Wing scene, projections have consequences. When wondering where in the world do we send much-needed resources, Mercator will lie to you, exaggerating land at the poles at the expense of equatorial regions. I am a longtime advocate for alternate projections, such as—from the West Wing scene—the Gall-Peters. I am an even bigger big fan of Dymaxion and Watterman projections. I think they look quite sci-fi because they are familiar-but-unfamiliar, and they have some advantages for showing things like abstract routes across the globe.
If any supergenre is here to help model the way things ought to be, it’s sci-fi. If you only have a second or less of time to show the map, then you may be locked to Mercator for its instant-recognizability, but if the camera lingers, or you have dialogue to address the unfamiliarity, or if the art direction is looking for uncanny-ness, I’d try for one of the others.
What is represented?
Of course you’re going to want to represent the cases on the map. That’s the core of it. And it may be enough if the simple takeaway is thing bad getting worse. But if the purpose of the map is to answer the question “what do we do,” the cases may not be enough. Recall that another primary goal of epidemiologists is to prevent further infections. And the map can help indicate this and inform strategy.
Take for instance, 06 APR 2020 of the COVID-19 epidemic in the United States. If you had just looked at a static map of cases, blue states had higher counts than red states. But blue states had been much more aggressive in adopting “flattening the curve” tactics, while red states had been listening to Trump and right wing media that had downplayed the risk for many weeks in many ways. (Read the Nate Silver post for more on this.) If you were an epidemiologist, seeing just the cases on that date might have led you to want to focus social persuasion resources on blue states. But those states have taken the science to heart. Red states on the other hand, needed a heavy blitz of media to convince them that it was necessary to adopt social distancing and shelter-in-place directives. With a map showing both cases andsocial acceptance of the pandemic, it might have helped an epidemiologist make the right resource allocation decision quickly.
Another example is travel routes. International travel played a huge role in spreading COVID-19, and visualizations of transportation routes can prove more informative in understanding its spread than geographic maps. Below is a screenshot of the New York Times’ beautiful COVID-19 MAR 2020 visualization How the Virus Got Out, which illustrates this point.
Other things that might be visualized depend, again, on the chain of transmission.
Is the pathogen airborne? Then you might need to show upcoming wind and weather forecasts.
Is the reservoir mosquitoes? Then you might want to show distance to bodies of still water.
Is the pathogen spread through the mycelial network? Then you might need to show an overlay of the cosmic mushroom threads.
Whatever your pathogen, use the map to show the epidemiologist ways to think about its future spread, and decide what to do. Give access to multiple views if needed.
How do you represent it?
When showing intensity-by-area, there are lots of ways you could show it. All of them have trade offs. The Johns-Hopkins dashboard uses a Proportional Symbol map, with a red dot, centered on the country or state, the radius of which is larger for more confirmed cases. I don’t like this for pandemics, mostly because the red dots begin to overlap and make it difficult to any detail without interacting with the map to get a better focus. It does make for an immediate read. In this 23 MAR 2020 screen cap, it’s pretty obvious that the US, Europe, and China are current hotspots, but to get more detail you have to zoom in, and the audience, if not the characters, don’t have that option. I suppose it also provides a tone-painting sense of unease when the symbols become larger than the area they are meant to represent. It looks and feels like the area is overwhelmed with the pathogen, which is an appropriate, if emotional and uninformative, read.
The Johns-Hopkins dashboard uses a proportional symbol map. And I am distraught at how quaint those numbers seem now, much less what they will be in the future.
Most of the sci-fi maps we see are a variety of Chorochromatic map, where color is applied to the discrete thing where it appears on the map. (This is as opposed to a Cloropleth map, where color fills in existing geopolitical regions.) The chorochromatic option is nice for sci-fi because the color makes a shape—a thing—that does not know of or respect geopolitical boundaries. See the example from Evolution below.
Governor Lewis watches the predicted spread of the Glen Canyon asteroid organisms out of Arizona and to the whole of North America. Evolution (2001)
It can be hard to know (or pointlessly-detailed) to show exactly where a given thing is on a map, like, say, where infected people literally are. To overcome this you could use a dot-distribution map, as in the Outbreak example (repeated below so you don’t have to scroll that far back up).
Outbreak (1995), again.
Like many such maps, the dot-distribution becomes solid red to emphasize passing over some magnitude threshold. For my money, the dots are a little deceptive, as if each dot represented a person rather than part of a pattern than indicates magnitude, but a glance at the whole map gives the right impression.
For a real world example of dot-distribution for COVID-19, see this example posted to reddit.com by user Edward-EFHIII.
COVID-19 spread from January 23 through March 14th.
Often times dot-distribution is reserved for low magnitudes, and once infections are over a threshold, become cloropleth maps. See this example from the world of gaming.
In Plague, Inc., you play the virus, hoping to win against humanity.
Here you can see that India and Australia have dots, while China, Kyrgyzstan, Tajikistan, Turkmenistan, and Afghanistan (I think) are “solid” red.
The other representation that might make sense is a cartogram, in which predefined areas (like country or state boundaries) are scaled to show the magnitude of a variable. Continuous-area cartograms can look hallucinogenic, and would need some explanation by dialogue, but can overcome the inherent bias that size = importance. It might be a nice secondary screen alongside a more traditional one.
On the left, a Choropleth map of the 2012 US presidential election, where it looks like red states should have won. On the right, a continuous cartogram with state sizes scaled to reflect states’ populations, making more intuitive sense why blue states carried the day.
Another gorgeous projection dispenses with the geographic layout. Dirk Brockman, professor at the Institute for Theoretical Biology, Humboldt University, Berlin, developed a visualization that places the epicenter of a disease at the center of a node graph, and plots every city around it based on how many airport flights it takes to get there. Plotting proportional symbols to this graph makes the spread of the disease radiate in mostly- predictable waves. Pause the animation below and look at the red circles. You can easily predict where the next ones will likely be. That’s an incredibly useful display for the epidemiologist. And as a bonus, it’s gorgeous and a bit mysterious, so would make a fine addition in a sci-fi display to a more traditional map. Read more about this innovative display on the CityLab blog. (And thanks, Mark Coleran, for the pointer.)
How does it move?
First I should say I don’t know that it needs to move. We have information graphics that display predicted change-over-area without motion: Hurricane forecast maps. These describe a thing’s location in time, and simultaneously, the places it is likely to be in the next few days.
National Hurricane Center’s 5-day forecast for Hurricane Florence, 08 SEP 2018. Image: NHC
If you are showing a chorochromatic map, then you can use “contour lines” or color regions to demonstrate the future predictions.
Not based on any real pathogen.
Another possibility is small multiples, where the data is spread out over space instead of time. This makes it harder to compare stages, but doesn’t have the user searching for the view they want. You can mitigate this with small lines on each view representing the boundaries of other stages.
Not based on any real pathogen.
The side views could also represent scenarios. Instead of +1, +2, etc., the side views could show the modeled results for different choices. Perhaps those scenario side views and their projected counts could be animated.
To sing the praises of the static map: Such a view, updated as data comes in, means a user does not have to wait for the right frame to pop up, or interact with a control to get the right piece of information, or miss some detail when they just happened to have the display paused on the wrong frame of an animation.
But, I realize that static maps are not as cinegenic as a moving map. Movement is critical to cinema, so a static map, updating only occasionally as new data comes in, could look pretty lifeless. Animation gives the audience more to feel as some red shape slowly spreads to encompass the whole world. So, sure. I think there are better things to animate than the primary map, but doing so puts us back into questions of style rather than usability, so I’ll leave off that chain of thought and instead show you the fourth example in this section, Contagion.
MEV-1 spreads from fomites! It’s fomites! Contagion (2011), designed by Cory Bramall of Decca Digital.
Later stages of the map are interspersed with viewer-reaction shots.
Prevent further transmissions: Containment strategies
The main tactic for epidemiological intervention is to deny pathogens the opportunity to jump to new hosts. The top-down way to do this is to persuade community leaders to issue broad instructions, like the ones around the world that have us keeping our distance from strangers, wearing masks and gloves, and sheltering-in-place. The bottom-up tactic is to identify those who have been infected or put at risk for contracting a pathogen from an infected person. This is done with contact tracing.
Contain Known Cases
When susceptible hosts simply do not know whether or not they are infected, some people will take their lack of symptoms to mean they are not infectious and do risky things. If these people are infectious but not yet showing symptoms, they spread the disease. For this reason, it’s critical to do contact tracing of known cases to inform and encourage people to get tested and adopt containment behaviors.
Contact tracing
There are lots of scenes in pathogen movies where scientists stand around whiteboards with hastily-written diagrams of who-came-into-contact-with-whom, as they hope to find and isolate cases, or to find “patient 0,” or to identify super-spreaders and isolate them.
These scenes seem ripe for improvement by technology and AI. There are opt-in self-reporting systems, like those that were used to contain COVID-19 in South Korea, or the proposed NextTrace system in the West. In sci-fi, this can go further.
Scenario: Imagine an epidemiologist talking to the WHO AI and asking it to review public footage, social media platforms, and cell phone records to identify all the people that a given case has been in contact with. It could even reach out and do field work, calling humans (think Google Duplex) who might be able to fill in its information gaps. Field epidemiologists are focused on situations when the suspected cases don’t have phones or computers.
Or, for that matter, we should ask why the machine should wait to be asked. It should be set up as an agent, reviewing these data feeds continually, and reaching out in real time to manage an outbreak.
SCENE: Karen is walking down the sidewalk when her phone rings.
Computer voice:
Good afternoon, Karen. This is Florence, the AI working on behalf of the World Health Organization.
Karen:
Oh no. Am I sick?
Computer voice:
Public records indicate you were on a bus near a person who was just confirmed to be infected. Your phone tells me your heart rate has been elevated today. Can you hold the phone up to your face so I can check for a fever?
Karen does. As the phone does its scan, people on the sidewalk behind her can be seen to read texts on their phone and move to the other side of the street. Karen sees that Florence is done, and puts the phone back to her ear.
Computer voice:
It looks as if you do have a fever. You should begin social distancing immediately, and improvise a mask. But we still need a formal test to be sure. Can you make it to the testing center on your own, or may I summon an ambulance? It is a ten minute walk away.
Karen:
I think I can make it, but I’ll need directions.
Computer voice:
Of course. I have also contacted your employer and spun up an AI which will be at work in your stead while you self-isolate. Thank you for taking care of yourself, Karen. We can beat this together.
Design challenge: In the case of an agentive contact tracer, the display would be a social graph displayed over time, showing confirmed cases as they connect to suspected cases (using evidence-of-proximity or evidence-of-transmission) as well as the ongoing agent’s work in contacting them and arranging testing. It would show isolation monitoring and predicted risks to break isolation. It would prioritize cases that are greatest risk for spreading the pathogen, and reach out for human intervention when its contact attempts failed or met resistance. It could be simultaneously tracing contacts “forward” to minimize new infections and tracing contacts backward to find a pathogen’s origins.
Another consideration for such a display is extension beyond the human network. Most pathogens mutate and much more freely in livestock and wild animal populations, making their way into humans occasionally. it happened this way for SARS (bats → civets → people), MERS (bats → camels → people), and COVID-19 (bats → pangolin → people). (Read more about bats as a reservoir.) It’s not always bats, by the way, livestock are also notorious breeding grounds for novel pathogens. Remember Bird flu? Swine flu? This “zoonotic network” should be a part of any pathogen forensic or surveillance interface.
Design idea: Even the notion of what it means to do contact tracing can be rethought in sci-fi. Have you seen the Mythbusters episode “Contamination”? In it Adam Savage has a tube latexed to his face, right near his nose that drips a florescent dye at the same rate a person’s runny nose might drip. Then he attends a staged dinner party where, despite keeping a napkin on hand to dab at the fluid, the dye gets everywhere except the one germophobe. It brilliantly illustrates the notion of fomites and how quickly an individual can spread a pathogen socially.
Now imagine this same sort of tracing, but instead of dye, it is done with computation. A camera watches, say, grocery shelves, and notes who touched what where and records the digital “touch,” or touchprint, along with an ID for the individual and the area of contact. This touchprint could be exposed directly with augmented reality, appearing much like the dye under black light. The digital touch mark would only be removed from the digital record of the object if it is disinfected, or after the standard duration of surface stability expires. (Surface stability is how long a pathogen remains a threat on a given surface). The computer could further watch the object for who touches it next, and build an extended graph of the potential contact-through-fomites.
Ew, I got touchprint on me.
You could show the AR touchprint to the individual doing the touching, this would help remind them to wear protective gloves if the science calls for it, or to ask them to disinfect the object themselves. A digital touchprint could also be used for workers tasked with disinfecting the surfaces, or by disinfecting drones. Lastly, if an individual is confirmed to have the pathogen, the touchprint graph could immediately identify those who had touched an object at the same spot as the infected person. The system could provide field epidemiologists with an instant list of people to contact (and things to clean), or, if the Florence AI described above was active, the system could reach out to individuals directly. The amount of data in such a system would be massive, and the aforementioned privacy issues would be similarly massive, but in sci-fi you can bypass the technical constraints, and the privacy issues might just be a part of the diegesis.
In case you’re wondering how long that touch mark would last for SARS-CoV-2 (the virus that causes COVID-19), this study from the New England Journal of Medicine says it’s 4 hours for copper, 24 hours for paper and cardboard, and 72 hours on plastic and steel.
Anyway, all of this is to say that the ongoing efforts by the agent to do the easy contact tracing would be an excellent, complicated, cinegenic side-display to a spreading pathogen map.
Destroying non-human reservoirs
Another way to reduce the risk of infection is to seal or destroy reservoirs. Communities encourage residents to search their properties and remove any standing water to remove the breeding grounds for mosquitos, for example. There is the dark possibility that a pathogen is so lethal that a government might want to “nuke it from orbit” and kill even human reservoirs. Outbreak features an extended scene where soldiers seek to secure a neighborhood known to be infected with the fictional Motoba virus, and soldiers threaten to murder a man trying to escape with his family. For this dark reason, in addition to distance-from-reservoir, the location of actual reservoirs may be important to your spreading pathogen map. Maybe also counts of the Hail Mary tools that are available, their readiness, effects, etc.
To close out the topic of What Do We Do? Let me now point you to the excellent and widely-citied Medium article by Tomas Peuyo, “Act Today or People Will Die,” for thoughts on that real-world question.
The…winner(?)
At the time of publication, this is the longest post I’ve written on this blog. Partly that’s because I wanted to post it as a single thing, but also because it’s a deep subject that’s very important to the world, and there are lots and lots of variables to consider when designing one.
Which makes it not surprising that most of the examples in this mini survey are kind of weak, with only one true standout. That standout is the World War Z spreading disaster map, shown below.
World War Z (2013)
It goes by pretty quickly, but you can see more features discussed above in this clip than any of the other exmaples.
A combination of chorochromatic marking for the zombie infection, and cloropleth marking for countries. Note the signals showing countries where data is unavailable.Along the bottom, rates (not cases) are expressed as “Population remaining.” That bar of people along the bottom would start slow and then just explode to red, but it’s a nice “things getting worse” moment. Maybe it’s a log scale?A nice augmentation of the main graphic is down the right-hand side. A day count in the upper right (with its shout-out to zombie classic 28 Days Later), and what I’m guessing are resources, including nukes.
It doesn’t have that critical layer of forecasting data, but it got so much more right than its peers, I’m still happy to have it. Thanks to Mark Coleran for pointing me to it.
Let’s not forget that we are talking about fiction, and few people in the audience will be epidemiologists, standing up in the middle of the cinema (remember when we could go to cinemas?) to shout, “What’s with this R0 of 0.5? What is this, the LaCroix of viruses?” But c’mon, surely we can make something other than Andromeda Strain’s Pathogen Kaleidoscope, or Contagion’s Powerpoint wipe. Modern sci-fi interfaces are about spectacle, about overwhelming the users with information they can’t possibly process, and which they feel certain our heroes can—but they can still be grounded in reality.
Lastly, while I’ve enjoyed the escapism of talking about pandemics in fiction, COVID-19 is very much with us and very much a threat. Please take it seriously and adopt every containment behavior you can. Thank you for taking care of yourself. We can beat this together.
The second half of the film is all about retrieving the data from Johnny’s implant without the full set of access codes. Johnny needs to get the data downloaded soon or he will die from the “synaptic seepage” caused by squeezing 320G of data into a system with 160G capacity. The bad guys would prefer to remove his head and cryogenically freeze it, allowing them to take their time over retrieval.
1 of 3: Spider’s Scanners
The implant cable interface won’t allow access to the data without the codes. To bypass this protection requires three increasingly complicated brain scanners, two of them medical systems and the final a LoTek hacking device. Although the implant stores data, not human memories, all of these brain scanners work in the same way as the Non-invasive, “Reading from the brain” interfaces described in Chapter 7 of Make It So.
The first system is owned by Spider, a Newark body modification specialist. Johnny sits in a chair, with an open metal framework surrounding his head. There’s a bright strobing light, switching on and off several times a second.
Nearby a monitor shows a large rotating image of his head and skull, and three smaller images on the left labelled as Scans 1 to 3.
The largest image resembles a current-day MRI or CT display. It is being drawn on a regular flat 2D display rather than as a 3D holographic type projection, so does not qualify as a volumetric projection even though a current day computer graphics programmer might call it such. The topmost Scan 1 is the head viewed from above in the same rendering style. Scan 2 in the middle shows a bright spot around the implant, and Scan 3 shows a circuit board, presumably the implant itself. The background is is blue, which so far has been common but not as predominant as it is in other science fiction interfaces. Chris suggests this is because blue LEDs were not common in 1995, so the physical lights we see are red and green and likewise the onscreen graphics use many bright colors.
Occasionally a purple bar slides across the main image. It perhaps represents some kind of processing update, but since the image is already rotating, that seems superfluous. At one point the color of the main image changes to red, with a matching red sliding bar, but we don’t know why. All the smaller images rotate or flash regularly, with faint ticking sounds as they do.
From this system, Spider is able to tell Johnny that there is a problem with his implant and it must be painful. (Understandably, Johnny is not impressed with this less than helpful diagnosis.) Unlike either the scanner at Newark Airport or the LoTek binoculars, there are no obvious messages or indicators providing this information. But this is a specialised piece of medical technology rather than a public access system, so presumably Spider has sufficient expertise to interpret the displays without needing large popup text.
2 of 3: Hospital Scanner
Spider takes Johnny to a hospital for a more thorough scan. Here the first step is attaching a black flexible strip with various cables around his head. His implant cable is also connected.
There isn’t a clear shot of the entire system, but behind Johnny is a CRT monitor and to his left, our right, is a bank of displays that look like electronic oscilloscopes. Since embedded body electronics are common in the world of Johnny Mnemonic, that is probably exactly what they are intended to be. Spider adjusts some controls on these.
The oscilloscopes show no text, just green lines and shapes. The CRT behind Johnny is now showing the same head image that we saw at the end of the previous scan.
In front of the oscilloscopes is a PC keyboard from the 1990s. In 2021 this will look even older, but this entire hospital is portrayed as a shoestring operation relying on donations and salvage. Spider types on the keyboard, and the CRT changes to show a lot of scrolling text.
This is enough for Spider to announce that the “data” is the cure for NAS, the world wide epidemic disease that Jane is showing symptoms of. Again it’s not clear how he can determine this, as the data is still protected by the access codes. Perhaps the scrolling text is unencrypted metadata in the implant that is more easily retrieved. Given the apparent hazardous life of a mnemonic courier, it would make sense to attach the equivalent of a sticky label to the implant, briefly describing the contents and who they should be delivered to.
(This is also the point where one has to ask why this valuable data is encrypted and protected to begin with. Using a mnemonic courier for distribution makes sense, to avoid content filters on the Internet. But now the data is here in Newark, with the intended recipients, so why is it so hard to get at? The best answer I can think of is that the scientists wanted to ensure that the mnemonic courier couldn’t keep the data for themselves and sell it to the highest bidder.)
The third of the three brain interfaces warrants its own post, coming up next.
After fleeing the Yakuza in the hotel, Johnny arrives in the Free City of Newark, and has to go through immigration control. This process appears to be entirely automated, starting with an electronic passport reader.
After that there is a security scanner, which is reminiscent of HAL from the film 2001: A Space Odyssey.
The green light runs over Johnny from top to bottom.
Looking at the picture, we can see that this green light is somehow making Johnny’s skeleton visible. It would be possible, by having an X-ray imaging system running at the same time and then re-projecting the X-ray image back onto the body, but why? Since there don’t appear to be any actual human beings on duty, I can only suggest that it is meant to look intimidating and impressive to encourage obedience. In the film Johnny appears to be alone and cannot see this himself, but it would be much more common for there to be multiple passengers, so each could watch the others being scanned.
There is also a screen showing another scan, a blurry body image, and text appearing on the right side. A voice repeats the text content. For the first time we see a blue background, the most common color for futuristic film interfaces.
The scanner detects Johnny’s implant, but whatever secrecy measures are present cause the system to decide that it is a registered dyslexia aid. The popup alert below includes the registration issuer and a domain name, so perhaps this is online verification over the Internet. Presumably Johnny can see this screen himself, if he cares.
The voiceover helpfully informs Johnny that there is “synaptic seepage”, and he should seek medical attention within 24 hours. This shows quite high level decision making by the system and an offer of assistance. Johnny says “thanks” in reply, an anthropomorphic response to this seemingly intelligent machine.
However, there seems to be a more detailed explanation in smaller text on the right of the display, and this isn’t announced. It’s not clear in this scene whether Johnny can see this display or not, but even if he could it would be difficult to read. Perhaps this is a legacy system from the days when airport security had actual staff.
Next
At this point Johnny leaves the airport, riding in a taxi from the airport. It is a good time for the first review of a group of related interfaces, which will be the next series of posts.
On each of the sleep pods in which the Odyssey crew sleep, there is a display for monitoring the health of the sleeper. It includes some biometric charts, measurements, a body location indicator, and a countdown timer. This post focuses on that timer.
To show the remaining time of until waking Julia, the pod’s display prompts a countdown that shows hours, minutes and seconds. It shows in red the final seconds while also beeping for every second. It pops-up over the monitoring interface.
Julia’s timer reaches 0:00:01.
The thing with pop-ups
We all know how it goes with pop-ups—pop-ups are bad and you should feel bad for using them. Well, in this case it could actually be not that bad.
The viewer
Although the sleep pod display’s main function is to show biometric data of the sleeper, the system prompts a popup to show the remaining time until the sleeper wakes up. And while the display has some degree of redundancy to show the data—i.e. heart rate in graphics and numbers— the design of the countdown brings two downsides for the viewer.
Position: it’s placed right in the middle of the screen.
Size: it’s roughly a quarter of the whole size of the display
Between the two, it partially covers both the pulse graphics and the numbers, which can be vital, i.e. life threatening—information of use to the viewer.
The sleeper
At the same time the display has another user, the sleeper. Since she can’t get back or respond in any way, this display is her only way of communication. As such, the device ought to react at least as well as a person would. So while normally a pop-up should only be used to show important data that the user really must know, this case is different. The pop up is not blindly blocking information, it’s reflecting the user’s priorities at that moment. And it’s for this reason that the timer bears that much visual importance on the screen.
But the display is also a touchscreen, which you can tell from the buttons in the timer. So in case the viewer really needs to see the entire display, it would require putting the timer in a separate mode. But that would require him switch back and forth between modes to get all the data.
When the countdown finishes, the pod slides open. Julia slowly begins to recover consciousness, open her eyes and sits to take a look around the outside.
Rome wasn’t built in 99 hours.
The countdown timer shows the amount of hours, minutes and seconds until the sleeper wakes, counting backwards. We just get to see the timer —and hear it beeping— only when the sleep time is ending, so it’s likely a feature to notify any close witness that the pod is about to open.
But what if the sleeper’s biometrics start to get bad? Well, the timer does leave enough room on the screen to leave the bulk of the biometrics data. The device also has a warning for when the sleeper is in CRITICAL condition, but we don’t get to see any in-between modes. It could be helpful if the timer offered some sound cue when the sleeper has some minor issue as well, even if it isn’t as bad. Even something as simple as changing the tone of the beep could do the trick.
Did you notice that the timer has two digits to display hours? That means it can display 99 hours of remaining time. That’s a long time. I’m guessing that the display doesn’t show the countdown with that much time in advance. But in that case, when does it show the timer? If the timer looks to give a hint when a sleeper is about to wake up, you don’t really need to know the amount of hours left. A few minutes’ advance notice is enough.
Kind-of setting the timer.
Although the crew of the Odyssey could probably handle the delta sleep from the onboard computer, the display also offers some functions to control that time. It has three buttons that control the timer:
a START button
a RESET button
a CLEAR button
The timer has two small half-circles both at the top and bottom of the clock. There is a play button. The timer needs to have a way to enter a given duration, and from the mapping of those symbols I’m guessing they could work as adding and subtracting buttons —you know, press the top button to add an hour, press the bottom button to reduce an hour. But at the same time the buttons don’t have any labels to convey that—they lack either a plus symbol on the top or a minus symbol on the bottom. For what it’s worth, the only label they offer is the time magnitude of any pair of digits—hours, minutes and seconds—on the circles at the bottom. So yeah, I’m close to calling these fuidgets.
The text buttons need some consideration as well. The first two are pretty straightforward if we envision the scenario where the clock timer can be set to any given time. In that case START will start the clock and RESET will put it back to zero, as with any common timer. The odd bit is that there is still a START button while the clock is ticking. In many common timers that same button has two modes that switch according to the state of the timer: starting it when it’s paused and pausing it when it it’s playing. But the missing pause mode or button could have a purpose, perhaps waking the sleeper requires a gradual biological process that can’t be stop once it has began.
There are other problems with the third one, the CLEAR button. Although the label is somewhat misleading, the button probably acts as a way to close the pop-up of the countdown, removing it from the screen. But the real issue is what happens after that. If the user press CLEAR and the pop-up closes, there is no way of knowing if the timer keeps running in the background or if it resets back to zero. This is a major problem.
Anyhow, even if the timer did run in the background it doesn’t have much of a point in this case. I mean, there was no one around to check on Julia while she was in sleep.
A little ramble on Industrial Design
Another interesting aspect of the design of the pods is the way they open. Instead of opening or sliding the cover to one side, as more common doors and hatches, the cover of the pods is divided in the middle like a double-leaf bascule drawbridge. These covers on the pod have a hinge both at the top and bottom, so they turn outside and up of the pod when opening.
Jack releases Julia from the sleep pod.
Although it may seem like an overly complicated design, it really shows its advantages when you set it in context. On the Odyssey the sleep pods are placed side by side, alongside the walls of a tube like compartment. There, the area around the center has hatches that lead to other compartments.
Within a space of those characteristics, a cover that opens or slides to the side would bring some problems. As the cover slides, when opening a pod you would be blocking the one next to it. To improve that, you could have a cover that opens up from the top or the bottom. With that you could have more than one pod closing and opening at the same time, but it also comes with drawbacks. Given the length of the pods those doors will probably cover much of the transit area around the compartments of the ship, becoming an obstacle for the movement of the crew.
This is a solution for both problems. The divided doors give plenty of space for the crew to pass through, and as the doors open up they also give room to opening or closing the pods next to each other at the same time.
After Johnny was mistakenly reported as killed, the next time we see him he is in a healing chamber, submerged in green-underlit translucent fluid, resting on form-fitting clear plastic supports. He breathes through a tube, and a pair of small robot arms work busily to regenerate the damaged tissue in his leg.
The main reason to discuss this chamber on a blog about interfaces is the material choice of the outside of the chamber. By being surrounded completely in a transparent material (glass? plexiglass? transparent aluminum?), it means that physicians can keep an eye on progress, and he can have visual interactions with visitors, as we see when Dizzy and Ace visit to share with him his mistaken death certificate (and for Dizzy to leave him a kiss.) Additionally it gives Johnny something to look at during the long hours of recuperation.
I’m not sure why the green light is necessary. The scene implies that it could serve some part in the healing process, but if not, I wonder if an amber light might signal a more human, nurturing warmth to Johnny and visitors. Narratively, you’d want to avoid anything too yellow or run the risk of the audience’s first interpretations drifting too far to the Andres-Serrano-esque.
The device with which the cosmetic surgery is conducted is delightfully called the Aesculaptor Mark III. Doc brags that it is “the latest. It’s completely self-contained.”
In it, the patient lies flat in a recess on a rounded table, the tilt and orientation of which is computer controlled. Above the table is a metallic sphere with six spidery articulated arms. Some of these house laser scalpels and some of these house healing sprays. The whole mechanism is contained in a cylinder of glass.
To control the system, Doc has a panel made up of unlabeled buttons and dials, a single blue monitor, and another panel displaying a random five-digit number and two levers. One is labeled “ANODYNE” and the other is labeled “KINESIS.”
When Doc receives a mysterious call (on what may be the earliest wireless telephone in mainstream science fiction,) he receives instructions to murder Logan. To do so he turns off the healing by moving the ANODYNE lever into the lower position.
So. Yeah. Also just terrible. I mean there’s the plot question. I ordinarily don’t drop into questions of plot, but come on. If Doc wanted to eliminate Logan, wouldn’t he increase the anodyne, so Logan wouldn’t know he was being killed until it was too late? If you wanted to torture him, wouldn’t you put him under a paralytic first, and only then turn off the anodyne? Turning on the KINESIS (moving lasers?) and turning off the anodyne just seem counter to his actual goals. Unless you want to fantheory this so that Doc’s instruction was “make him escape.”
But yes, back to the interface. There’s almost nowhere to start. Undifferentiated controls? Unlabeled controls? No visual hierarchy? Only the device itself and an oscilloscope to monitor the system and the patient’s trending state? Un-safeguarded knife switches for the primary controls? And note that the fail state is in the direction of gravity. If that knife switch gets loose, oops, you’re screwed.
Logan’s Run took place long before the lessons of the Therac-25, with its tragic interface and programming problems that resulted in the deaths of several cancer patients, but even audiences in 1976 would not believe that any medical device would have such an easy means of disabling the only aspect of it that keeps it from becoming an abattoir.


 Caveat #1: As a public service I have included some information about COVID-19 in the body of the post with a link to sources. These are called out the way this paragraph is, with a SARS-CoV-2 illustration floated on the left. I have done as much due diligence as one blogger can do to not spread disinformation, but keep in mind that our understanding of this disease and the context are changing rapidly. By the time you read this, facts may have changed. Follow links to sources to get the latest information. Do not rely solely on this post as a source. If you are reading this from the relative comfort of the future after COVID-19, feel free to skip these.


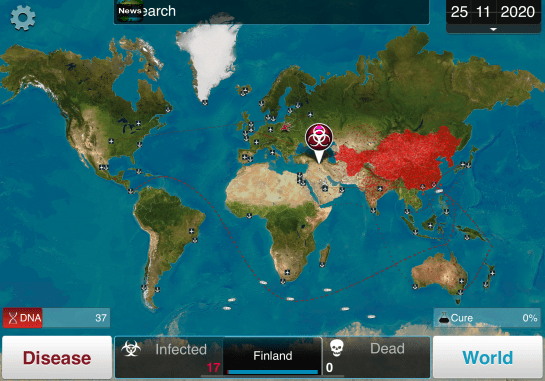


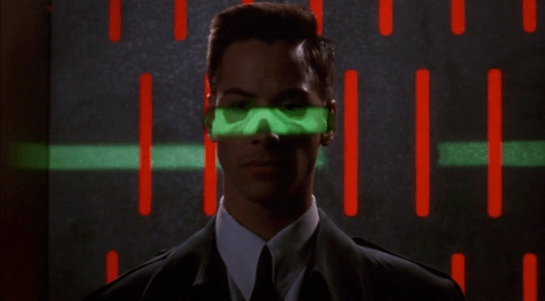


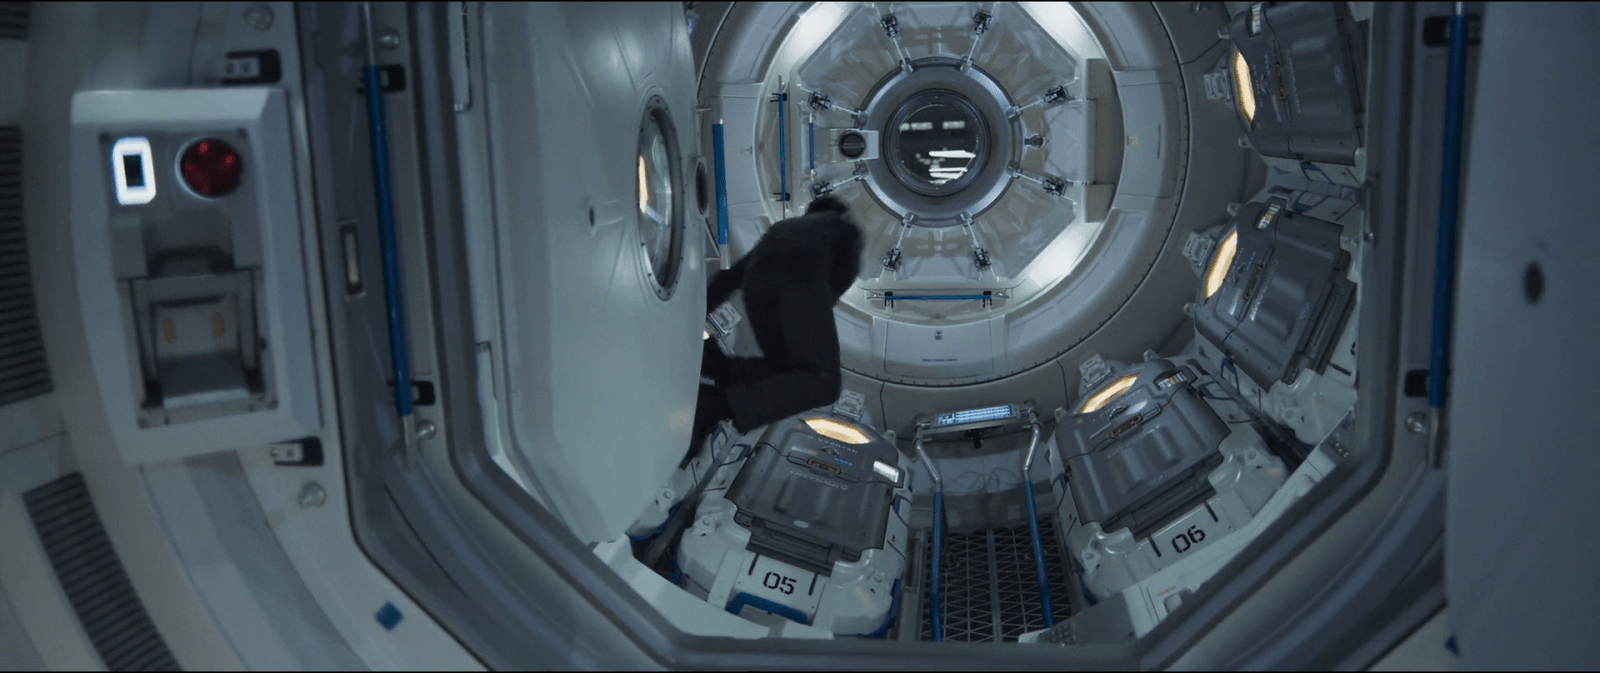


