So I missed synchronizing the Fritzes with the Oscars. By like, a lot. A lot a lot. That hype curve has come and gone. (In my defense, it’s been an intensely busy year.) I don’t think providing nominees and then waiting to reveal winners makes sense now, so I’ll just talk about them. It was another year where there weren’t a lot of noteworthy speculative interfaces, from an interaction design point of view. This is true enough that I didn’t have enough candidates to fill out my usual three categories of Believable, Narrative, and Overall. So, I’m just going to do a round-up of some of the best interfaces as I saw them, and at the end, name an absolute favorite.
The Kitchen
In a dystopian London, the rich have eliminated all public housing but one last block known as The Kitchen. Izi and Benji live there and are drawn together by the death of Benji’s mother, who turns out to be one of Izi’s romantic partners from the past. The film is full of technology, but the one part that really struck me was the Life After Life service where Izi works and where Benji’s mom’s funeral happens. It’s reminiscent of the Soylent Green suicide service, but much better done, better conceived. The film has a sci-fi setting, but don’t expect easy answers and Marvel-esque plot here. This film about relationships amid struggle and ends quite ambiguously.
The funerary interfaces are mostly translucent cyans with pinstripe dividing lines to organize everything. In the non-funerary the cyan is replaced with bits of saturated red. Everything funerary and non- feels as if it has the same art direction, which lends to reading the interfaces extradiegetically, but maybe that’s part of the point?
Pod Generation
This dark movie considers what happens if we gestated babies in technological wombs called pods. The interactions with the pod are all some corporate version of intuitive, as if Apple had designed them. (Though the swipe-down to reveal is exactly backwards. Wouldn’t an eyelid or window shade metaphor be more natural? Maybe they were going for an oven metaphor, like bun in the oven? But cooking a child implications? No, it’s just wrong.)
The design is largely an exaggeration of Apple’s understated aesthetic, except for the insane, giant floral eyeball that is the AI therapist. I love how much it reads like a weirdcore titan and the characters are nonplussed, telegraphing how much the citizens of this world have normalized to inhumanity. I have to give a major ding to the iPad interface by which parents take care of their fetuses, as its art direction is a mismatch to everything else in the film and seems quite rudimentary, like a Flash app circa 1998.
Before I get to the best interfaces of the year, let’s take a moment to appreciate two trends I saw emerging in 2023. That of hyperminimalist interfaces and of interface-related comedy.
Hyperminimalist interfaces
This year I noticed that many movies are telling stories with very minimal interfaces. As in, you can barely call them designed since they’re so very minimalist. This feels like a deliberate contrast to the overwhelming spectacle that permeates, say, the MCU. They certainly reduce the thing down to just the cause and effect that are important to the story. Following are some examples that illustrate this hyperminimalism.
Fingernails—fingernail-tester.No One Will Save You—observation pod.57 Seconds—time ring.Landscape with Invisible Hand—translation device (there on the desk under the alien’s hand)
This could be a cost-saving tactic, but per the default New Criticism stance of this blog, we’ll take it as a design choice and note it’s trending.
Shout-out: Interface Comedy
I want to give a special shout-out to interface-related comedy over the past year.
Smoking Causes Coughing
The first comes from the French gonzo horror sci-fi Smoking Causes Coughing. In a nested story told by a barracuda that is on a grill being cooked, Tony is the harried manager of a log-processing plant whose day is ruined by her nephew’s somehow becoming stuck in an industrial wood shredder. Over the scene she attempts to reverse the motor, failing each time, partly owing to the unlabeled interface and bad documentation. It’s admittedly not sci-fi, just in a sci-fi film, and a very gory, very hilarious bit of interface humor in an schizoid film.
Guardians of the Galaxy 3
The second is Guardians of the Galaxy 3. About a fifth of the way into the movie, the team spacewalks from the Milano to the surface of Orgocorp to infiltrate it. Once on the surface, Peter, who still pines for alternate-timeline Gamora, tries to strike up a private conversation with her. The suits have a forearm interface featuring a single row of colored stay-state buttons that roughly match the colors of the spacesuits they’re wearing. Quill presses the blue one and tries in vain to rekindle the spark between him and Gamora in a private conversation. But then a minute into the conversation, Mantis cuts in…
Mantis
Peter you know this is an open line, right?
Peter
What?
Mantis
We’re listening to everything you’re saying.
Drax
And it is painful.
Quill
And you’re just telling me now‽
Nebula
We were hoping it would stop on its own.
Peter
But I switched it over to private!
Mantis
What color button did you push?
Peter
Blue! For the blue suit!
Drax
Oh no.
Nebula
Blue is the open line for everyone.
Mantis
Orange is for blue.
Peter
What‽
Mantis
Black is for orange. Yellow is for green. Green is for red. And red is for yellow.
Drax
No, yellow is for yellow. Green is for red. Red is for green.
Mantis
I don’t think so.
Drax
Try it then.
Mantis (screaming)
HELLO!
Peter writhes in pain
Mantis
You were right.
Peter
How the hell and I supposed to know all of that?
Drax
Seems intuitive.
The Marvels
A third comedy bit happens in The Marvels, when Kamala Khan is nerding out over Monica Rambeau’s translucent S.H.I.E.L.D. tablet. She says…
Khan
Is this the new iPad? I haven’t seen it yet.
Rambeau
I wish.
Khan
Wait, if this is all top secret information, why is it on a clear case?
Anyway, I want to give a shout-out to the writers for demonstrating with these comedy bits some self-awareness and good-natured self-owning of tropes. I see you and appreciate you. You are so valid.
Best Interfaces of 2023
But my favorite interfaces of 2023 come from Spider-Man: Across the Spider-Verse. The interfaces throughout are highly stylized (so might be tough to perform the detailed analysis, which is this site’s bread-and-butter) but play the plot points perfectly.
In Across the Spider-Verse, while dealing difficulties with his home life and chasing down a new supervillain called The Spot, Miles Morales learns about The Society. The Society is a group of (thousands? Tens of thousands? of) Spider-people of every stripe and sort from across the Multiverse, whose overriding mission is to protect “canon” events in each universe that, no matter how painful, they believe are necessary to keep the fabric of reality from unraveling. It’s full of awesome interfaces.
Lyla is the general artificial intelligence that has a persistent volumetric avatar. She’s sassy and disagreeable and stylish and never runs, just teleports.
The wrist interfaces—called the Multiversal Gizmo—worn by members of The Society all present highly-contextual information with most-likely actions presented as buttons, and, as needed, volumetric alerts. Also note that Miguel’s Gizmo is longer, signaling his higher status within The Society.
Of special note is volumetric display that Spider Gwen uses to reconstruct the events at the Alchemax laboratory. The interface is so smart, telegraphs its complex functioning quickly and effectively, and describes a use that builds on conceivable but far-future applications of inference. The little dial that pops up allowing her to control time of the playback reminds me of Eye of Agamatto (though sadly I didn’t see evidence of the important speculative time-control details I’d provided in that analysis). The in-situ volumetric reconstruction reminds me of some of the speculative interfaces I’d proposed in the review of Deckard’s photo inspector from Blade Runner, and so was a big thrill to see.
All of the interfaces have style, are believable for the diegesis, and contribute to the narrative with efficiency. Congratulations to the team crafting these interfaces, and if you haven’t seen it yet, what are you waiting for? Go see it. It’s in a lot of places and the interfaces are awesome. (For full disclosure, I get no kickback from these referral links.)
We interrupt the 3D file browsing series for this Santa-holiday one-off post. If you’re trapped somewhere needing design-and-Santa-related distraction, here’s a bunch of words, images, and links for you.
Longtime readers may recall the Who Did it Better? Santa Claus edition from 2020, in which I took a look at speculative interfaces that help Santa Claus do his Saintly Nick business. (If not, check it out at the link above, especially if you need a refresher on the core myth.) Earlier this year a dear friend mentioned Rise the Guardians as an additional candidate. So I watched it, and hereby add it as an addendum to that study. I might make it a habit to do every year, because they aren’t going to stop making Santa movies anytime soon.
Spoiler alert: There aren’t many interfaces, and they don’t fare well, but the joy is in the analysis, so let’s dive in.
Quick plot recap
Children around the world are protected by a group called the Guardians:
North (Santa)
Tooth (the Tooth Fairy)
(the Easter) Bunnymund
Sandman
…all appointed by the mysterious Man in the Moon. Who is just the moon, communicating via moonbeams.
Pictured: A plot-critical character peering in through the shutter like some kind of celestial stalker.
One day, an ancient foe named Pitch Black returns, who plots to get all the children to stop believing in the guardians, thereby robbing them of their power and clearing the way for his fear-mongering world domination. In response, the Man in the Moon names a new Guardian to help defeat him: Jack Frost. Jack initially resists, but over the course of the film and the help of one special child, Jack comes around, learns to care, and helps defeat Pitch. Children around the world believe in him, and he formally joins the ranks of the Guardians.
Our heroes face off against Pitch. Sandman is Disney-dead at this point in the story, and so not pictured.
n.b. Santa’s are only a subset of the film’s devices
The abilities of the Guardians are a blend of innate magic and magic items, fueled with *vaguely gestures at childhood belief* and not a lot of observable cause-and-effect interfaces. For instance, when Pitch breaks Jack’s magic crook, Jack just holds the pieces and wills it back whole with glowy sparkliness and grunting psychic effort despite never having done anything like this before. No interfaces there. Magic things don’t really befit the usual sort of analysis done on this blog. But North does have three interfaces to do his gift-giving duties that bear the cold light of examination, you heartless, Vulcan bastards. (Yaaay! My people!)
Snow globes
Sleigh dashboard
The Belief Globe
(Tooth and her hummingbird-like Baby Teeth helpers have some proper interfaces as well, but are kind of creepy and this post is about Santa tech. Maybe I’ll do teeth tech interfaces later. Maybe March 6.)
Snow globes
These handheld spheres look like the popular winter decorations, but with no base by which they can rest on a surface. Instead they are kept loose in the user’s pocket until they are needed. By shaking it and speaking a destination, a preview of the destination appears on the inside, surrounded by swirls of “snow.” Then by pitching it like a baseball, the globe disappears in a puff, replaced with a circular portal to that destination. Move or toss something through, and the portal closes behind.
Two of North’s yetis use a snow globe to open a portal to the arctic citadel, and toss North’s sack (with a kidnapped Jack inside) through.
…the destination has a unique and easily identifiable landmark to display in the globe
…the appearance of the destination is already known to the user, so the visual helps confirm the selection
But change any one of these, and it starts to fail. Consider if North, in the course of doing his Santa-ly duties, had to jump to a “San José.” There are at least 334 San Josés around the world. Very few of which have identifiable landmarks. How does North know the one that’s being visualized is the right one? He might have eidetic memory because of Рождество Христово magic or something, but these tools are used by the yetis, too, and I doubt they have that same gift.
How would it help them disambiguate? If the displayed destination is not the right one, how does the user provide more specificity to get to the right one? What if they only know the name? How does the snow globe help them narrow things down from 334 to 1? Since the globe disappears on use, and pockets have a limited capacity, the cost for getting it wrong can be quite high. The yetis might very well have to walk back to the North Pole should they run out.
Maybe, maybe, there are only a limited number of destinations possible, but then you’d expect some reference on the globe itself to help a user know that.
Pictured in the globe: a San José from Google Earth, and I’ll send a free PDF copy of the book to the first person who names which San José correctly, because I’m fairly confident it’s nigh-impossible.
It’s also worth noting that there’s no indication how the portals know when it’s OK to close, rather than say, chopping the traveler in half or leaving them stranded. Is it time-based? Where’s the countdown? Is it dependent on a code word or thought? How does the user know whether the code word has been received or rejected? Does the portal close as soon as a single, “whole object” passes through? Theseus would like a word. There’s no interface in evidence, so it must be “smart,” but as we know, “smart” is not always smart, and design is critical for making users more confident and avoiding costly errors. There are far too many unanswered questions to give this any stamp of approval.
Sleigh dashboard
North has a sleigh of course. It has a dashboard with some controls. One of these controls we see in use is a lever, whose purpose is a mystery. It can’t be a booster, since the motile force here is rangiferine, not mechanical. The control is shaped like an engine control lever on a boat or a thrust control on an airplane. After the switch is thrown, the camera cuts to a very blurry shot of the sleigh’s undercarriage where, if something happens, I can’t discern what is it. Maybe the runners go from flat to vertical, for a more ice-skating-like experience? Exacerbating our lack of information, the control is unlabeled, so it’s hard for a new user to know what it does, or what state it’s in, or what the options are. It has no safety mechanism, so depending on the force required, might be easily accidentally activated. Cannot recommend this, either.
This does…nothing? Are those arrows on the side meaningful? It’s hard to say.But hey it’s activated now…good?Can anyone tell what’s happened here? See around 00:28:00 in the movie.
The major element in the dashboard is a large globe inset in its center. It’s roughly shoulder-width in diameter. We never see it in use, but it bears great resemblance to the Belief Globe (see below). I want to believe it’s a you-are-here navigation device that automatically orients to match the position and bearing of the sleigh, because that might be useful. And it would be an awesome opportunity for a super-charming brass location indicator, mounted to a quarter-meridian arm. But I suspect this device is actually meant to be a miniaturized copy of the Belief Globe, which would not be useful for reasons you’ll read in the next section.
North and Jack chuckle at Bunnymund’s terror of flying. Fear is so funny.
The Belief Globe
This display is not explicitly named over the course of the movie, but I have to call it something. It is a huge globe that mechanically rotates in the center of North’s arctic fortress. It is covered with beautiful, arcane symbols and Cyrillic writing (North is Russian—this movie was from the halcyon days between the end of the Cold War and its horrific current genocidal landgrab attempts against Ukraine), and displays tiny points of light all over it.
Tooth, explaining the globe to Jack, says, “Each of those lights is a child.” North explains further, “A child who believes.” But some of the dots are bigger and others brighter. It’s unclear what information those variables are meant to convey. Older kids? Degree of belief? Relative niceness? We don’t see anyone looking into individual dots, which, if that’s not possible, really means that this device, diegetically, just shows where the Guardians might want to focus their activities, conspicuously, to bolster Belief in that geographical area.
And belief seems to be at critical levels. I asked chatGPT to count the dots in the second image in the gallery above. It estimated 39,674 dots and that that pictured chunk of South America to be about 12% of the world’s total landmass, excluding Antarctica. South America has around 5% of the world’s total population, which extrapolates out to a total 725,280 dots we would expect to see across the world. According to populationpyramid.com, global population in 2012—the time this film was released—was 7.2 billion, with 1.91 billion being 14 years old or younger (a generous age for childlike belief, since the average age of losing faith in a “real” Santa tends to be around 10 years old in the USA, but let’s run with it.)
I am delighted that this happens to look like a morbid, morbid Christmas tree.
That means that in the world of the Guardians, only 4 out of 100 children believe in any of them to begin with, even before Pitch comes a-calling. This would have been so easy to fix in the script. Have Tooth say, “These lights represent children who believe.” The plural would have left it ambiguous.
But I’ve digressed.
North has a viewing deck which seems custom-built for observing the globe, and which gives us an important perspective for analysis.
This over-the-yeti-shoulder shot helps point out a major failing of this display: visibility of the information.
With the globe anchored in place at the poles and the observation deck so low, this makes the dots in the southern hemisphere much more prominent in the viewers’ sight, introducing an availability bias. It looks like anything above 50N latitude is just…out of sight, and that includes significant populations in Europe as well as North’s own fortress. (We’ll see in the Control Panel that there’s a miniature globe mounted there that provides a view of the Northern Hemisphere, but we don’t see lights on it, and it would be a bad idea to split the information across two sources of differing scales, anyway. So let’s hope that’s not its intended purpose.)
There is an easy fix for the orientation problem, and it of course comes from the world of globe-making. By attaching the poles of the globe to a full meridian that encircles the globe, and then attaching the full meridian to a half meridian at the equator, you create a gimbal that allows the globe to rotate to any orientation.
This is called a full-swing mount, and it would allow arbitrary inspection of any point on the globe. It would be lovely to see writ large and mechanical in the film.
This display also privileges land in a possibly-misleading way, in the same way that election maps can. Let’s all recall that land doesn’t vote, but this kind of implies otherwise.
Same image as above, repeated for easy reference.
For example, on the Belief Globe, it looks like Australian kids are way behind in Belief metrics than New Zealand kids, but Australia has a density of 3.4 inhabitants per square kilometer compared to New Zealand’s 19.1, and this map doesn’t make that easy to understand. Proportion of per capita belief would be a better metric for delivering actionable Santa insight.
Like this, but inverse. From Colin Mathers on Medium.
Even better would be to show change in belief over time (“боже мой!” North might shout, “Bunny! Get to Czech Republic, немедленно!”), though information over time is notoriously difficult to do on a geographical map.
Various shots of the control panel.
But even if we solve the orientation and representation problems, putting the information on a globe means at least half of it is out of sight at any given time. In the yeticam view above, what’s going on in Bermuda? You don’t know! It does revolve slowly, but by my own rough estimation at the speed we see in this scene, it would take around 6 minutes for this globe to make a complete, sidereal rotation, which is way, way beyond the vigilance threshold limit required to put that picture together holistically in your mind. If the whole picture is important (and I’m asserting that it is), the information display should be a map rather than a globe.
Eh…it’s a crappy Midjourney comp, but you get the gist.
You don’t want to lose the charming magical-Soviet machine feeling of it, but with a world map, maybe you have some mechanics that physically simulate the day/night cycle? And since the Man in the Moon is so important to this story, maybe the lunar cycle as well? Or you could make some mechanical interactive fisheye focus effect, which would be even more spectacular. (Please, somebody, do this.)
I also have to note that having Belief hold such a prominent place in this command and control room seems really self-serving. That much real estate is dedicated to telling you how much gas you have in the tank? There are plenty of additional things that a Santa and his team would want to keep track of that would be of as much importance: Days until Christmas, location of kids at risk of losing belief, percentage of toys complete, bowl-full-of-jelly BMI score, naughty/nice balance in the world, current value of elf pension fund, just to name a few. These could be split-flap displays for nostalgia and lovely clacking audio opportunities.
Globe Control Panel
On the observation deck, North has a control panel of sorts. There are two parts whose functions we can infer, a trackball and a Bat-Guardian-Signal, but most of it—like the levers and joysticks with lit toggle buttons—we cannot. Let’s look at the two whose purpose we can infer.
The trackball
The trackball is a miniature Belief Globe, inset on the right hand of the control panel. It is quite similar to the trackballs we see in Arthur Christmas (2011, the year before) and The Christmas Chronicles (2018, six years later). If it controls the orientation of the Belief Globe, and its movement is constrained similarly to how the globe is, a user hoping to focus on Mauritius would have to memorize that it is due south of Oman, and do the same for the entirety of the southern hemisphere.
I hope you‘ve memorized your world geography, mate.
It should also be constrained to left-right movement like the thing being controlled, as if on a hidden inclination mount. But this looks like a free-spin trackball, so could use a knob in the pole and maybe a meridian arm to help signal its constraint. It should also be well-mapped to the globe as the observer sees it. It is not. Compare the orientation of the Globe to the trackball in the screen shot. They do not match.
All told, a pretty underthought component.
Bat-Guardian-Signal
Early in the film, when North realizes Pitch is back, he grabs the control in the far lower-right-hand corner. He twists it 90 degrees counterclockwise and pushes down. The ice-like octagonal button below begins to glow brightly.
This sets the Belief Globe to glowing with aurora lights, that extend out across the globe and alert the Guardians, signaling them to report to Commissioner Gordon North’s compound at once. Mentioned here only out of a sense of completeness, this control is germane to North’s being leader of a team rather than any of his Santa duties. It’s unlabeled, it can’t possibly have the global reach that it needs, and I’m not sure why the Globe was selected to be the source of the aurora, but meh, it’s just not that important in this context.
Final score: Lump of Coal
We have to keep in mind this is a movie for kids, and kids won’t be put off by any of these interface failings. But for our overthinking design-nerd purposes in reviewing the Santa tech, these just don’t hold up. Because of this, Rise of the Guardian’s Santa tech poses zero threat to dethroning The Santa Chronicle’s lovely Santa interfaces. But good to remind ourselves of the principles to which we should be paying attention.
Enjoy the movie for the fun voice acting, the awesome character design, the gorgeous Sandman visuals, and any nearby kids’ sense of wonder, but don’t worry about the interfaces as anything to admire or mimic in the real world.
Also screw this one homophobic elf. Violence is not an acceptable response to cheek kissing, especially in a country like Russia where that is the norm, and especially-especially in a movie catering to children.
Happy holidays, however you celebrate, to most everyone except you, asshole elf.
So while the world is in the grip of the novel COVID-19 coronavirus pandemic, I’ve been thinking about those fictional user interfaces that appear in pandemic movies that project how quickly the infectious-agent-in-question will spread. The COVID-19 pandemic is a very serious situation. Most smart people are sheltering in place to prevent an overwhelmed health care system and finding themselves with some newly idle cycles (or if you’re a parent like me, a lot fewer idle cycles). Looking at this topic through the lens of sci-fi is not to minimize what’s happening around us as trivial, but to process the craziness of it all through this channel that I’ve got on hand. I did it for fascism, I’ll do it for this. Maybe this can inform some smart speculative design.
Caveat #1:As a public service I have included some information about COVID-19 in the body of the post with a link to sources. These are called out the way this paragraph is, with a SARS-CoV-2 illustration floated on the left. I have done as much due diligence as one blogger can do to not spread disinformation, but keep in mind that our understanding of this disease and the context are changing rapidly. By the time you read this, facts may have changed. Follow links to sources to get the latest information. Do not rely solely on this post as a source. If you are reading this from the relative comfort of the future after COVID-19, feel free to skip these.
Get on a boat, Hongkongers, you can’t even run for the hills! Contagion (2011)
And yes, this is less of my normal fare of sci-fi and more bio-fi, but it’s still clearly a fictional user interface, so between that and the world going pear-shaped, it fits well enough. I’ll get back to Blade Runner soon enough. I hope.
Giving credit where it’s due: All but one of the examples in this post were found via the TV tropes page for Spreading Disaster Map Graphic page, under live-action film examples. I’m sure I’ve missed some. If you know of others, please mention it in the comments.
Four that are extradiegetic and illustrative
This first set of pandemic maps are extradiegetic.
Vocabulary sidebar: I use that term a lot on this blog, but if you’re new here or new to literary criticism, it bears explanation. Diegesis is used to mean “the world of the story,” as the world in which the story takes place is often distinct from our own. We distinguish things as diegetic and extradiegetic to describe when they occur within the world of the story, or outside of it, respectively. My favorite example is when we see a character in a movie walking down a hallway looking for a killer, and we hear screechy violins that raise the tension. When we hear those violins, we don’t imagine that there is someone in the house who happens to be practicing their creepy violin. We understand that this is extradiegetic music, something put there to give us a clue about how the scene is meant to feel.
So, like those violins, these first examples aren’t something that someone in the story is looking at. (Claude Paré? Who the eff is—Johnson! Get engineering! Why are random names popping up over my pandemic map?) They’re something the film is doing for us in the audience.
The Killer that Stalked New York (1950) is a short about a smallpox infection of New York City.
Edge of Tomorrow (2014) has this bit showing the Mimics, spreading their way across Europe.
The end of Rise of the Planet of the Apes (2011) shows the fictional virus ALZ-113 spreading.
The beginning of Dawn of the Planet of the Apes (2014) repeats the fictional virus ALZ-113 spreading, but augments it with video overlays.
There’s not much I feel the need to say about these kinds of maps, as they are a motion graphic and animation style. I note at least two use aposematic signals in their color palette and shapes, but that’s just because it helps reinforce for the audience that whatever is being shown here is a major threat to human life. But I have much more authoritative things to say about systems that are meant to be used.
Before we move on, here’s a bonus set of extradiegetic spreading-pathogen maps I saw while watching the Netflix docuseries Pandemic: How to Prevent an Outbreak, as background info for this post.
The five examples in this section are spread throughout the text for visual interest, but presented in chronological order. They are The Andromeda Strain (1977), Outbreak (1995), Evolution (2001), Contagion (2011), and World War Z (2013). I highly recommend Contagion for the acting, movie making, the modeling, and some of the facts it conveys. For instance, I think it’s the only film that discusses fomites. Everyone should know about fomites.
Since I raise their specter: As of publication of this post the CDC stated that fomites are not thought to be the main way the COVID-19 novel coronavirus spreads, but there are recent and conflicting studies. The scientific community is still trying to figure this out. The CDC says for certain it spreads primarily through sneezes, coughs, and being in close proximity to an infected person, whether or not they are showing symptoms.
Note that these five spreading pathogen examples are things that characters are seeing in the diegesis, that is, in the context of the story. These interfaces are meant to convey useful information to the characters as well as us in the audience.
Which is as damning a setup as I can imagine for this first example from The Andromeda Strain (1971). Because as much as I like this movie, WTF is this supposed to be? “601” is explained in the dialogue as the “overflow error” of this computer, but the pop-art seizure graphics? C’mon. There’s no way to apologize for this monstrosity.
This psychedelic nonsense somehow tells the bunkered scientists about how fast the eponymous Andromeda Strain will spread. (1971) Somehow the CRT gets nervous, too.
I’m sorry that you’ll never get those 24 seconds back. But at least we can now move on to look at the others, which we can break down into the simple case of persuasion, and the more complex case of use.
The simple case
In the simplest case, these graphics are shown to persuade an authority to act. That’s what happening in this clip from Outbreak (1995).
General Donald McClintock delivers a terrifying White House Chief-of-Staff Briefing about the Motaba virus. Outbreak (1995)
But if the goal is to persuade one course of action over another, some comparison should be made between two options, like, say, what happens if action is taken sooner rather than later. While that is handled in the dialogue of many of these films—and it may be more effective for in-person persuasion—I can’t help but think it would be reinforcing to have it as part of the image itself. Yet none of our examples do this.
Compare the “flatten the curve” graphics that have been going around. They provide a visual comparison between two options and make it very plain which is the right one to pick. One that stays in the mind of the observer even after they see it. This is one I’ve synthesized and tweaked from other sources.
This is a conceptual diagram, not a chart. The capacity bar is terrifyingly lower on actual charts. Stay home as much as you can. Special shouts out to Larry West.
There is a diegetic possibility, i.e., that no one amidst the panic of the epidemic has the time to thoughtfully do more than spit out the data and handle the rest with conversation. But we shouldn’t leave it at that, because there’s not much for us to learn there.
More complex case
The harder problem is when these displays are for people who need to understand the nature of the threat and determine the best course of action, and now we need to talk about epidemiology.
Caveat #2:I am not an epidemiologist. They are all really occupied for the foreseeable future, so I’m not even going to reach out and bother one of them to ask their opinions on this post. Like I said before about COVID-19, I really hope you don’t come to sci-fi interfaces to become an expert in epidemiology. And, since I’m just Some Guy on the Internet Who Has Read Some Stuff on the Internet, you should take whatever you learn here with a grain of salt. If I get something wrong, please let me know. Here are my major sources:
Kate Winslet, playing epidemiologist Dr. Erin Mears in Contagion (2011), is probably more qualified than me. Hey, Kate: Call me. I have questions.
Caveat #3: To discuss using technology in our species’ pursuit of an effective global immune system is to tread into some uncomfortable territory. Because of the way disease works, it is not enough to surveil the infected. We must always surveil the entire population, healthy or not, for signs of a pathogen outbreak, so responses can be as swift and certain as possible. We may need to surveil certain at-risk or risk-taking populations quite closely, as potential superspreaders. Otherwise we risk getting…well…*gestures vaguely at the USA*. I am pro-privacy, so know that when I speak about health surveillance in this post, I presume that we are simultaneously trying to protect as much “other” privacy as we can, maybe by tracking less-abusable, less-personally identifiable signals. I don’t pretend this is a trivial task, and I suspect the problem is more wicked than merely difficult to execute. But health surveillance must happen, and for this reason I will speak of it as a good thing in this context.
Epidemiology is a large field of study, so for purposes of this post, we’re talking about someone who studies disease at the level of the population, rather than individual cases. Fictional epidemiologists appear when there is an epidemic or pandemic in the plot, and so are concerned with two questions: What are we dealing with? and What do we need to do?
Part 1: What are we dealing with?
Our response should change for different types of threat. So it’s important for an epidemiologist to understand the nature of a pathogen. There are a few scenes in Contagion where we see scientists studying a screen with gene sequences and a protein-folding diagram, and this touches on understanding the nature of the virus. But this is a virologists view, and doesn’t touch on most of what an epidemiologist is ultimately hoping to build first, and that’s a case definition. It is unlikely to appear in a spreading pathogen map, but it should inform one. So even if your pathogen is fictional, you ought to understand what one is.
“We’ve sequenced the virus and determined its origin, and we’ve modeled the way it edges the cells of the lung and the brain…” —Dr. Hextall, Contagion (2011)
A case definition is the standard shared definition of what a pathogen is; how a real, live human case is classified as belonging to an epidemic or not. Some case definitions are built for non-emergency cases, like for influenza. The flu is practically a companion to humanity, i.e., with us all the time, and mutates, so its base definition for health surveillance can be a little vague. But for the epidemics and pandemics that are in sci-fi, they are building a case definitionfor outbreak investigations. These are for a pathogen in a particular time and place, and act as a standard for determining whether or not a given person is counted as a case for the purposes of studying the event.
Case definition for outbreak investigations
The CDC lists the following as the components of a case definition.
Clinical criteria
Clinical description
Confirmatory laboratory tests
These can be pages long, with descriptions of recommended specimen collections, transportation protocols, and reporting details.
Combinations of symptoms (subjective complaints)
Signs (objective physical findings)
Source
(Sometimes) Specifics of time and place.
There are sometimes different case definitions based on the combination of factors. COVID-19 case definitions with the World Health Organization, for instance, are broken down between suspect, probable, and confirmed. A person showing all the symptoms and who has been in an area where an infected person was would be suspect. A person whose laboratory results confirmed the presence of SARS-CoV-2 is confirmed. Notably for a map, these three levels might warrant three levels of color.
As an example, here is the CDC case definition for ebola, as of 09 JUL 2019.
n.b. Case definitions are unlikely to work on screen
Though the case definition is critical to epidemiology, and may help the designer create the spreading pathogen map (see the note about three levels of color, above), but the thing itself is too text-heavy to be of much use for a sci-fi interface, which rely much more on visuals. Better might be the name or an identifying UUID to the definition. WHO case references look like this: WHO/COVID-19/laboratory/2020.5 I do not believe the CDC has any kind of UUID for its case definitions.
While case definitions don’t work on screen, counts and rates do. See below under Surveil Public Health for more on counts and rates.
Disease timeline
Infectious disease follows a fairly standard order of events, depicted in the graphic below. Understanding this typical timeline of events helps you understand four key metrics for a given pathogen: chains of transmission, R0, SI, and CFR.
For each of the key metrics, I’ll list ranges and variabilities where appropriate. These are observed attributes in the real world, but an author creating a fictional pathogen, or a sci-fi interfaces maker needing to illustrate them, may need to know what those numbers look like and how they tend to behave over time so they can craft these attributes.
Chains of Transmission
What connects the individual cases in an epidemic are the methods of transmission. The CDC lists the following as the basics of transmission.
Reservoir: where the pathogen is collected. This could be the human body, or a colony of infected mynocks, a zombie, or a moldy Ameglian Major flank steak forgotten in a fridge. Or your lungs.
Portal of exit, or how the pathogen leaves the reservoir. Say, the open wound of a zombie, or an innocent recommendation, or an uncovered cough.
Mode of transmission tells how the pathogen gets from the portal of exit to the portal of entry. Real-world examples include mosquitos, fomites (you remember fomites from the beginning of this post, don’t you?), sex, or respiratory particles.
Portal of entry, how the pathogen infects a new host. Did you inhale that invisible cough droplet? Did you touch that light saber and then touch your gills? Now it’s in you like midichlorians.
Susceptible host is someone more likely than not to get the disease.
A map of this chain of transmission would be a fine secondary-screen to a spreading pathogen map, illustrating how the pathogen is transmitted. After all, this will inform the containment strategies.
Variability: Once the chain of transmission is known, it would only change if the pathogen mutated.
Basic Rate of Reproduction = How contagious it is
A famous number that’s associated with contagiousness is the basic reproduction rate. If you saw Contagion you’ll recall this is written as R0, and pronounced “R-naught.” It describes, on average, how many people an infected person will infect before they stop being infectious.
If R0 is below 1, an infected person is unlikely to infect another person, and the pathogen will quickly die out.
If R0 is 1, an infected person is likely to infect one other, and the disease will continue through a population at a steady rate without intervention.
If R0 is higher than 1, a pathogen stands to explode through a population.
The CDC book tells me that R0 describes how the pathogen would reproduce through the population with no intervention, but other sources talk of lowering the R0 so I’m not certain if those other sources are using it less formally, or if my understanding is wrong. For now I’ll go with the CDC, and talk about R0 as a thing that is fixed.
It, too, is not an easy thing to calculate. It can depend on the duration of contagiousness after a person becomes infected, or the likelihood of infection for each contact between a susceptible person and an infectious person or vector, and the contact rate.
Variability: It can change over time. When a novel pathogen first emerges, the data is too sparse and epidemiologists are scrambling to do the field work to confirm cases. As more data comes in and numbers get larger, the number will converge toward what will be its final number.
It can also differ based on geography, culture, geopolitical boundaries, and the season, but the literature (such as I’ve read) refers to R0 as a single number.
Range: The range of R0 >1 can be as high as 12–18, but measles morbillivirus is an infectious outlier. Average range of R0, not including measles, of this sample is 2.5–5.2. MEV-1 from Contagion has a major dramatic moment when it mutates and its predicted R0 becomes 4, making it roughly as contagious as the now-eradicated killer smallpox.
Serial interval is the average time between successive cases in a chain of transmission. This tells the epidemiologist how fast a pathogen stands to spread through a population.
Variability: Like the other numbers, SI is calculated and updated with new cases while an epidemic is underway, but tend to converge toward a number. SI for some respiratory diseases is charted below. Influenza A moves very fast. Pertussis is much slower.
Range: As you can see in the chart, SI can be as fast as 2.2 days, or as slow as 22.8 days. The median in this set is 14 days and the average is 12.8. SARS-CoV-2 is currently estimated to be about 4 days, which is very fast.
The case fatality rate is a percentage that any given case will prove fatal. It is very often shortened to CFR. This is not always easy to calculate.
Variability: Early in a pandemic it might be quite low because hospital treatment is still available. Later in a pandemic, as hospital and emergency rooms are packed full, the CFR might raise quite high. Until a pathogen is eradicated, the precise CFR is changing with each new case. Updates can occur daily, or in real time with reports. In a sci-fi world, it could update real time directly from ubiquitous sensors, and perhaps predicted by a specialty A.I. or precognitive character.
Range: Case fatality rates range from the incurable, like kuru, at 100%. to 0.001% for chickenpox affecting unvaccinated children. The CFR changes greatly at the start of a pandemic and slowly converges towards its final number.
So, if the spreading pathogen map is meant to convey to an epidemiologist the nature of the pathogen, it should display these four factors:
Mode of Transmission: How it spreads
R0: How contagious it is
SI: How fast it spreads
CFR: How deadly it is
Part 2: What do we do?
An epidemiologist during an outbreak has a number of important responsibilities beyond understanding the nature of the pathogen. I’ve taken a crack at listing those below. Note: this list is my interpretation of the CDC materials, rather than their list. As always, offer corrections in comments.
Surveil the current state of things
Prevent further infections
Communicate recommendations
Epidemiology has other non-outbreak functions, but those routine, non-emergency responsibilities rarely make it to cinema. And since “communicate recommendations” is pretty covered under “The Simple Case,” above, the rest of this post will be dedicated to health surveillance and prevention tools.
Surveil the current state of things
In movies the current state of things is often communicated via the spreading pathogen map in some command and control center. The key information on these maps are counts and rates.
Counts and Rates
The case definition (above) helps field epidemiologists know which cases to consider in the data set for a given outbreak. They routinely submit reports of their cases to central authorities like the CDC or WHO, who aggregate them into counts, which are tallies of known cases. (And though official sources in the real world are rightly cautious to do it, sci-fi could also include an additional layer of suspected or projected cases.) Counts, especially over time, are important for tracking the spread of a virus. Most movie goers have basic numeracy, so red number going up = bad is an easy read for an audience.
Counts can be broken down into many variables. Geopolitical regions make sense as governmental policies and cultural beliefs can make meaningful distinctions in how a pathogen spreads. In sci-fi a speculative pathogen might warrant different breakdowns, like frequency of teleportation, or time spent in FTL warp fields, or genetic distance from the all-mother.
In the screen cap of the John Hopkins COVID-19 tracker, you can see counts high in the visual hierarchy for total confirmed (in red), total deaths (in white), and total recovered (in green). The map plots current status of the counts.
Rates is another number that epidemiologists are interested in, to help normalize the spread of a pathogen for different group sizes. (Colloquially, rate often implies change over time, but in the field of epidemiology, it is a static per capita measurement of a point in time.) For example, 100 cases is around a 0.00001% rate in China, with its population of 1.386 billion, but it would be a full 10% rate of Vatican City, so count can be a poor comparison to understand how much of a given population is affected. By representing the rates alongside the counts you can detect if it’s affecting a subgroup of the global population more or less than others of its kind, which may warrant investigation into causes, or provide a grim lesson to those who take the threat lightly.
Counts and rates over time
The trend line in the bottom right of the Johns Hopkins dashboard helps understand how the counts of cases are going over time, and might be quite useful for helping telegraph the state of the pandemic to an audience, though having it tucked in a corner and in orange may not draw attention as it needs to for instant-understanding.
These two displays show different data, and one is more cinegenic than the other. Confirmed cases, on the left, is a total, and at best will only ever level off. If you know what you’re looking at, you know that older cases represented by the graph are…uh…resolved (i.e. recovery, disability, or death) and that a level-off is the thing we want to see there. But the chart on the right plots the daily increase, and will look something like a bell curve when the pandemic comes to an end. That is a more immediate read (bad thing was increasing, bad thing peaked, bad thing is on the decline) and so I think is better for cinema.
At a glance you can also tell that China appears to have its shit sorted. [Obviously this is an old screen grab.]
In the totals, sparklines would additionally help a viewer know whether things are getting better or getting worse in the individual geos, and would help sell the data via small multiples on a close-up.
Plotting cases on maps
Counts and rates are mostly tables of numbers with a few visualizations. The most cinegenic thing you can show are cases on geopolitical maps. All of the examples, except the trainwreck that is The Andromedia Strain pathogen map, show this, even the extradiegetic ones. Real-world pathogens mostly spread through physical means, so physical counts of areas help you understand where the confirmed cases are.
Which projection?
But as we all remember from that one West Wing scene, projections have consequences. When wondering where in the world do we send much-needed resources, Mercator will lie to you, exaggerating land at the poles at the expense of equatorial regions. I am a longtime advocate for alternate projections, such as—from the West Wing scene—the Gall-Peters. I am an even bigger big fan of Dymaxion and Watterman projections. I think they look quite sci-fi because they are familiar-but-unfamiliar, and they have some advantages for showing things like abstract routes across the globe.
If any supergenre is here to help model the way things ought to be, it’s sci-fi. If you only have a second or less of time to show the map, then you may be locked to Mercator for its instant-recognizability, but if the camera lingers, or you have dialogue to address the unfamiliarity, or if the art direction is looking for uncanny-ness, I’d try for one of the others.
What is represented?
Of course you’re going to want to represent the cases on the map. That’s the core of it. And it may be enough if the simple takeaway is thing bad getting worse. But if the purpose of the map is to answer the question “what do we do,” the cases may not be enough. Recall that another primary goal of epidemiologists is to prevent further infections. And the map can help indicate this and inform strategy.
Take for instance, 06 APR 2020 of the COVID-19 epidemic in the United States. If you had just looked at a static map of cases, blue states had higher counts than red states. But blue states had been much more aggressive in adopting “flattening the curve” tactics, while red states had been listening to Trump and right wing media that had downplayed the risk for many weeks in many ways. (Read the Nate Silver post for more on this.) If you were an epidemiologist, seeing just the cases on that date might have led you to want to focus social persuasion resources on blue states. But those states have taken the science to heart. Red states on the other hand, needed a heavy blitz of media to convince them that it was necessary to adopt social distancing and shelter-in-place directives. With a map showing both cases andsocial acceptance of the pandemic, it might have helped an epidemiologist make the right resource allocation decision quickly.
Another example is travel routes. International travel played a huge role in spreading COVID-19, and visualizations of transportation routes can prove more informative in understanding its spread than geographic maps. Below is a screenshot of the New York Times’ beautiful COVID-19 MAR 2020 visualization How the Virus Got Out, which illustrates this point.
Other things that might be visualized depend, again, on the chain of transmission.
Is the pathogen airborne? Then you might need to show upcoming wind and weather forecasts.
Is the reservoir mosquitoes? Then you might want to show distance to bodies of still water.
Is the pathogen spread through the mycelial network? Then you might need to show an overlay of the cosmic mushroom threads.
Whatever your pathogen, use the map to show the epidemiologist ways to think about its future spread, and decide what to do. Give access to multiple views if needed.
How do you represent it?
When showing intensity-by-area, there are lots of ways you could show it. All of them have trade offs. The Johns-Hopkins dashboard uses a Proportional Symbol map, with a red dot, centered on the country or state, the radius of which is larger for more confirmed cases. I don’t like this for pandemics, mostly because the red dots begin to overlap and make it difficult to any detail without interacting with the map to get a better focus. It does make for an immediate read. In this 23 MAR 2020 screen cap, it’s pretty obvious that the US, Europe, and China are current hotspots, but to get more detail you have to zoom in, and the audience, if not the characters, don’t have that option. I suppose it also provides a tone-painting sense of unease when the symbols become larger than the area they are meant to represent. It looks and feels like the area is overwhelmed with the pathogen, which is an appropriate, if emotional and uninformative, read.
The Johns-Hopkins dashboard uses a proportional symbol map. And I am distraught at how quaint those numbers seem now, much less what they will be in the future.
Most of the sci-fi maps we see are a variety of Chorochromatic map, where color is applied to the discrete thing where it appears on the map. (This is as opposed to a Cloropleth map, where color fills in existing geopolitical regions.) The chorochromatic option is nice for sci-fi because the color makes a shape—a thing—that does not know of or respect geopolitical boundaries. See the example from Evolution below.
Governor Lewis watches the predicted spread of the Glen Canyon asteroid organisms out of Arizona and to the whole of North America. Evolution (2001)
It can be hard to know (or pointlessly-detailed) to show exactly where a given thing is on a map, like, say, where infected people literally are. To overcome this you could use a dot-distribution map, as in the Outbreak example (repeated below so you don’t have to scroll that far back up).
Outbreak (1995), again.
Like many such maps, the dot-distribution becomes solid red to emphasize passing over some magnitude threshold. For my money, the dots are a little deceptive, as if each dot represented a person rather than part of a pattern than indicates magnitude, but a glance at the whole map gives the right impression.
For a real world example of dot-distribution for COVID-19, see this example posted to reddit.com by user Edward-EFHIII.
COVID-19 spread from January 23 through March 14th.
Often times dot-distribution is reserved for low magnitudes, and once infections are over a threshold, become cloropleth maps. See this example from the world of gaming.
In Plague, Inc., you play the virus, hoping to win against humanity.
Here you can see that India and Australia have dots, while China, Kyrgyzstan, Tajikistan, Turkmenistan, and Afghanistan (I think) are “solid” red.
The other representation that might make sense is a cartogram, in which predefined areas (like country or state boundaries) are scaled to show the magnitude of a variable. Continuous-area cartograms can look hallucinogenic, and would need some explanation by dialogue, but can overcome the inherent bias that size = importance. It might be a nice secondary screen alongside a more traditional one.
On the left, a Choropleth map of the 2012 US presidential election, where it looks like red states should have won. On the right, a continuous cartogram with state sizes scaled to reflect states’ populations, making more intuitive sense why blue states carried the day.
Another gorgeous projection dispenses with the geographic layout. Dirk Brockman, professor at the Institute for Theoretical Biology, Humboldt University, Berlin, developed a visualization that places the epicenter of a disease at the center of a node graph, and plots every city around it based on how many airport flights it takes to get there. Plotting proportional symbols to this graph makes the spread of the disease radiate in mostly- predictable waves. Pause the animation below and look at the red circles. You can easily predict where the next ones will likely be. That’s an incredibly useful display for the epidemiologist. And as a bonus, it’s gorgeous and a bit mysterious, so would make a fine addition in a sci-fi display to a more traditional map. Read more about this innovative display on the CityLab blog. (And thanks, Mark Coleran, for the pointer.)
How does it move?
First I should say I don’t know that it needs to move. We have information graphics that display predicted change-over-area without motion: Hurricane forecast maps. These describe a thing’s location in time, and simultaneously, the places it is likely to be in the next few days.
National Hurricane Center’s 5-day forecast for Hurricane Florence, 08 SEP 2018. Image: NHC
If you are showing a chorochromatic map, then you can use “contour lines” or color regions to demonstrate the future predictions.
Not based on any real pathogen.
Another possibility is small multiples, where the data is spread out over space instead of time. This makes it harder to compare stages, but doesn’t have the user searching for the view they want. You can mitigate this with small lines on each view representing the boundaries of other stages.
Not based on any real pathogen.
The side views could also represent scenarios. Instead of +1, +2, etc., the side views could show the modeled results for different choices. Perhaps those scenario side views and their projected counts could be animated.
To sing the praises of the static map: Such a view, updated as data comes in, means a user does not have to wait for the right frame to pop up, or interact with a control to get the right piece of information, or miss some detail when they just happened to have the display paused on the wrong frame of an animation.
But, I realize that static maps are not as cinegenic as a moving map. Movement is critical to cinema, so a static map, updating only occasionally as new data comes in, could look pretty lifeless. Animation gives the audience more to feel as some red shape slowly spreads to encompass the whole world. So, sure. I think there are better things to animate than the primary map, but doing so puts us back into questions of style rather than usability, so I’ll leave off that chain of thought and instead show you the fourth example in this section, Contagion.
MEV-1 spreads from fomites! It’s fomites! Contagion (2011), designed by Cory Bramall of Decca Digital.
Later stages of the map are interspersed with viewer-reaction shots.
Prevent further transmissions: Containment strategies
The main tactic for epidemiological intervention is to deny pathogens the opportunity to jump to new hosts. The top-down way to do this is to persuade community leaders to issue broad instructions, like the ones around the world that have us keeping our distance from strangers, wearing masks and gloves, and sheltering-in-place. The bottom-up tactic is to identify those who have been infected or put at risk for contracting a pathogen from an infected person. This is done with contact tracing.
Contain Known Cases
When susceptible hosts simply do not know whether or not they are infected, some people will take their lack of symptoms to mean they are not infectious and do risky things. If these people are infectious but not yet showing symptoms, they spread the disease. For this reason, it’s critical to do contact tracing of known cases to inform and encourage people to get tested and adopt containment behaviors.
Contact tracing
There are lots of scenes in pathogen movies where scientists stand around whiteboards with hastily-written diagrams of who-came-into-contact-with-whom, as they hope to find and isolate cases, or to find “patient 0,” or to identify super-spreaders and isolate them.
These scenes seem ripe for improvement by technology and AI. There are opt-in self-reporting systems, like those that were used to contain COVID-19 in South Korea, or the proposed NextTrace system in the West. In sci-fi, this can go further.
Scenario: Imagine an epidemiologist talking to the WHO AI and asking it to review public footage, social media platforms, and cell phone records to identify all the people that a given case has been in contact with. It could even reach out and do field work, calling humans (think Google Duplex) who might be able to fill in its information gaps. Field epidemiologists are focused on situations when the suspected cases don’t have phones or computers.
Or, for that matter, we should ask why the machine should wait to be asked. It should be set up as an agent, reviewing these data feeds continually, and reaching out in real time to manage an outbreak.
SCENE: Karen is walking down the sidewalk when her phone rings.
Computer voice:
Good afternoon, Karen. This is Florence, the AI working on behalf of the World Health Organization.
Karen:
Oh no. Am I sick?
Computer voice:
Public records indicate you were on a bus near a person who was just confirmed to be infected. Your phone tells me your heart rate has been elevated today. Can you hold the phone up to your face so I can check for a fever?
Karen does. As the phone does its scan, people on the sidewalk behind her can be seen to read texts on their phone and move to the other side of the street. Karen sees that Florence is done, and puts the phone back to her ear.
Computer voice:
It looks as if you do have a fever. You should begin social distancing immediately, and improvise a mask. But we still need a formal test to be sure. Can you make it to the testing center on your own, or may I summon an ambulance? It is a ten minute walk away.
Karen:
I think I can make it, but I’ll need directions.
Computer voice:
Of course. I have also contacted your employer and spun up an AI which will be at work in your stead while you self-isolate. Thank you for taking care of yourself, Karen. We can beat this together.
Design challenge: In the case of an agentive contact tracer, the display would be a social graph displayed over time, showing confirmed cases as they connect to suspected cases (using evidence-of-proximity or evidence-of-transmission) as well as the ongoing agent’s work in contacting them and arranging testing. It would show isolation monitoring and predicted risks to break isolation. It would prioritize cases that are greatest risk for spreading the pathogen, and reach out for human intervention when its contact attempts failed or met resistance. It could be simultaneously tracing contacts “forward” to minimize new infections and tracing contacts backward to find a pathogen’s origins.
Another consideration for such a display is extension beyond the human network. Most pathogens mutate and much more freely in livestock and wild animal populations, making their way into humans occasionally. it happened this way for SARS (bats → civets → people), MERS (bats → camels → people), and COVID-19 (bats → pangolin → people). (Read more about bats as a reservoir.) It’s not always bats, by the way, livestock are also notorious breeding grounds for novel pathogens. Remember Bird flu? Swine flu? This “zoonotic network” should be a part of any pathogen forensic or surveillance interface.
Design idea: Even the notion of what it means to do contact tracing can be rethought in sci-fi. Have you seen the Mythbusters episode “Contamination”? In it Adam Savage has a tube latexed to his face, right near his nose that drips a florescent dye at the same rate a person’s runny nose might drip. Then he attends a staged dinner party where, despite keeping a napkin on hand to dab at the fluid, the dye gets everywhere except the one germophobe. It brilliantly illustrates the notion of fomites and how quickly an individual can spread a pathogen socially.
Now imagine this same sort of tracing, but instead of dye, it is done with computation. A camera watches, say, grocery shelves, and notes who touched what where and records the digital “touch,” or touchprint, along with an ID for the individual and the area of contact. This touchprint could be exposed directly with augmented reality, appearing much like the dye under black light. The digital touch mark would only be removed from the digital record of the object if it is disinfected, or after the standard duration of surface stability expires. (Surface stability is how long a pathogen remains a threat on a given surface). The computer could further watch the object for who touches it next, and build an extended graph of the potential contact-through-fomites.
Ew, I got touchprint on me.
You could show the AR touchprint to the individual doing the touching, this would help remind them to wear protective gloves if the science calls for it, or to ask them to disinfect the object themselves. A digital touchprint could also be used for workers tasked with disinfecting the surfaces, or by disinfecting drones. Lastly, if an individual is confirmed to have the pathogen, the touchprint graph could immediately identify those who had touched an object at the same spot as the infected person. The system could provide field epidemiologists with an instant list of people to contact (and things to clean), or, if the Florence AI described above was active, the system could reach out to individuals directly. The amount of data in such a system would be massive, and the aforementioned privacy issues would be similarly massive, but in sci-fi you can bypass the technical constraints, and the privacy issues might just be a part of the diegesis.
In case you’re wondering how long that touch mark would last for SARS-CoV-2 (the virus that causes COVID-19), this study from the New England Journal of Medicine says it’s 4 hours for copper, 24 hours for paper and cardboard, and 72 hours on plastic and steel.
Anyway, all of this is to say that the ongoing efforts by the agent to do the easy contact tracing would be an excellent, complicated, cinegenic side-display to a spreading pathogen map.
Destroying non-human reservoirs
Another way to reduce the risk of infection is to seal or destroy reservoirs. Communities encourage residents to search their properties and remove any standing water to remove the breeding grounds for mosquitos, for example. There is the dark possibility that a pathogen is so lethal that a government might want to “nuke it from orbit” and kill even human reservoirs. Outbreak features an extended scene where soldiers seek to secure a neighborhood known to be infected with the fictional Motoba virus, and soldiers threaten to murder a man trying to escape with his family. For this dark reason, in addition to distance-from-reservoir, the location of actual reservoirs may be important to your spreading pathogen map. Maybe also counts of the Hail Mary tools that are available, their readiness, effects, etc.
To close out the topic of What Do We Do? Let me now point you to the excellent and widely-citied Medium article by Tomas Peuyo, “Act Today or People Will Die,” for thoughts on that real-world question.
The…winner(?)
At the time of publication, this is the longest post I’ve written on this blog. Partly that’s because I wanted to post it as a single thing, but also because it’s a deep subject that’s very important to the world, and there are lots and lots of variables to consider when designing one.
Which makes it not surprising that most of the examples in this mini survey are kind of weak, with only one true standout. That standout is the World War Z spreading disaster map, shown below.
World War Z (2013)
It goes by pretty quickly, but you can see more features discussed above in this clip than any of the other exmaples.
A combination of chorochromatic marking for the zombie infection, and cloropleth marking for countries. Note the signals showing countries where data is unavailable.Along the bottom, rates (not cases) are expressed as “Population remaining.” That bar of people along the bottom would start slow and then just explode to red, but it’s a nice “things getting worse” moment. Maybe it’s a log scale?A nice augmentation of the main graphic is down the right-hand side. A day count in the upper right (with its shout-out to zombie classic 28 Days Later), and what I’m guessing are resources, including nukes.
It doesn’t have that critical layer of forecasting data, but it got so much more right than its peers, I’m still happy to have it. Thanks to Mark Coleran for pointing me to it.
Let’s not forget that we are talking about fiction, and few people in the audience will be epidemiologists, standing up in the middle of the cinema (remember when we could go to cinemas?) to shout, “What’s with this R0 of 0.5? What is this, the LaCroix of viruses?” But c’mon, surely we can make something other than Andromeda Strain’s Pathogen Kaleidoscope, or Contagion’s Powerpoint wipe. Modern sci-fi interfaces are about spectacle, about overwhelming the users with information they can’t possibly process, and which they feel certain our heroes can—but they can still be grounded in reality.
Lastly, while I’ve enjoyed the escapism of talking about pandemics in fiction, COVID-19 is very much with us and very much a threat. Please take it seriously and adopt every containment behavior you can. Thank you for taking care of yourself. We can beat this together.
This is one of those sci-fi interactions that seems simple when you view it, but then on analysis it turns out to be anything but. So set aside some time, this analysis will be one of the longer ones even broken into four parts.
The Eye of Agamotto is a medallion that (spoiler) contains the emerald Time Infinity Stone, held on by a braided leather strap. It is made of brass, about a hand’s breadth across, in the shape of a stylized eye that is covered by the same mystical sigils seen on the rose window of the New York Sanctum, and the portal door from Kamar-Taj to the same.
World builders may rightly ask why this universe-altering artifact bears a sigil belonging to just one of the Sanctums.
We see the Eye used in three different places in the film, and in each place it works a little differently.
The Tibet Mode
The Hong Kong Modes
The Dark Dimension Mode
The Tibet Mode
When the film begins, the Eye is under the protection of the Masters of the Mystic Arts in Kamar-Taj, where there’s even a user manual. Unfortunately it’s in mysticalese (or is it Tibetan? See comments) so we can’t read it to understand what it says. But we do get a couple of full-screen shots. Are there any cryptanalysists in the readership who can decipher the text?
They really should put the warnings before the spells.
The power button
Strange opens the old tome and reads “First, open the eye of Agamotto.” The instructions show him how to finger-tut a diamond shape with both hands and spread them apart. In response the lid of the eye opens, revealing a bright green glow within. At the same time the components of the sigil rotate around the eye until they become an upper and lower lid. The green glow of this “on state” persists as long as Strange is in time manipulation mode.
Once it’s turned on, he puts the heels of his palms together, fingers splayed out, and turns them clockwise to create a mystical green circle in the air before him. At the same time two other, softer green bands spin around his forearm and elbow. Thrusting his right hand toward the circle while withdrawing his left hand behind the other, he transfers control of the circle to just his right hand, where it follows the position of his palm and the rotation of his wrist as if it was a saucer mystically glued there.
Then he can twist his wrist clockwise while letting his fingers close to a fist, and the object on which he focuses ages. When he does this to an apple, we see it with progressively more chomps out of it until it is a core that dries and shrivels. Twisting his wrist counter clockwise, the focused object reverses aging, becoming younger in staggered increments. With his middle finger upright, the object reverts to its “natural” age.
Pausing and playing
At one point he wants to stop practicing with the apple and try it on the tome whose pages were ripped out. He relaxes his right hand and the green saucer disappears, allowing him to manipulate it and a tome without changing their ages. To reinstate the saucer, he extends his fingers out and gives his hand a shake, and it fades back into place.
Tibet Mode Analysis: The best control type
The Eye has a lot of goodness to it. Time has long been mapped to circles in sun dials and clock faces, so the circle controls fit thematically quite well. The gestural components make similar sense. The direction of wrist twist coincides with the movement of clock hands, so it feels familiar. Also we naturally look at and point at objects of focus, so using the extended arm gesture combined with gaze monitoring fits the sense of control. Lastly, those bands and saucers look really cool, both mystical in pattern and vaguely technological with the screen-green glow.
Readers of the blog know that it rarely just ends after compliments. To discuss the more challenging aspects of this interaction with the Eye, it’s useful to think of it as a gestural video scrubber for security footage, with the hand twist working like a jog wheel. Not familiar with that type of control? It’s a specialized dial, often used by video editors to scroll back and forth over video footage, to find particular sequences or frames. Here’s a quick show-and-tell by YouTube user BrainEatingZombie.
Is this the right kind of control?
There are other options to consider for the dial types of the Eye. What we see in the movie is a jog dial with hard stops, like you might use for an analogue volume control. The absolute position of the control maps to a point in a range of values. The wheel stops at the extents of the values: for volume controls, complete silence on one end and max volume at the other.
But another type is a shuttle wheel. This kind of dial has a resting position. You can turn it clockwise or counterclockwise, and when you let go, it will spring back to the resting position. While it is being turned, it enacts a change. The greater the turn, the faster the change. Like a variable fast-forward/reverse control. If we used this for a volume control: a small turn to the left means, “Keep lowering the volume a little bit as long as I hold the dial here.” A larger turn to the left means, “Get quieter faster.” In the case of the Eye, Strange could turn his hand a little to go back in time slowly, and fully to reverse quickly. This solves some mapping problems (discussed below) but raises new issues when the object just doesn’t change that much across time, like the tome. Rewinding the tome, Strange would start slow, see no change, then gradually increase speed (with no feedback from the tome to know how fast he was going) and suddenly he’d fly way past a point of interest. If he was looking for just the state change, then we’ve wasted his time by requiring him to scroll to find it. If he’s looking for details in the moment of change, the shuttle won’t help him zoom in on that detail, either.
There are also free-spin jog wheels, which can specify absolute or relative values, but since Strange’s wrist is not free-spinning, this is a nonstarter to consider. So I’ll make the call and say what we see in the film, the jog dial, is the right kind of control.
So if a jog dial is the right type of dial, and you start thinking of the Eye in terms of it being a video scrubber, it’s tackling a common enough problem: Scouring a variable range of data for things of interest. In fact, you can imagine that something like this is possible with sophisticated object recognition analyzing security footage.
The investigator scrubs the video back in time to when the Mona Lisa, which since has gone missing, reappears on the wall.
INVESTIGATOR
Show me what happened—across all cameras in Paris—to that priceless object…
She points at the painting in the video.
…there.
So, sure, we’re not going to be manipulating time any…uh…time soon, but this pattern can extend beyond magic items a movie.
The scrubber metaphor brings us nearly all the issues we have to consider.
What are the extents of the time frame?
How are they mapped to gestures?
What is the right display?
What about the probabilistic nature of the future?
What are the extents of the time frame?
Think about the mapping issues here. Time goes forever in each direction. But the human wrist can only twist about 270 degrees: 90° pronation (thumb down) and 180° supination (thumb away from the body, or palm up). So how do you map the limited degrees of twist to unlimited time, especially considering that the “upright” hand is anchored to now?
The conceptually simplest mapping would be something like minutes-to-degree, where full pronation of the right hand would go back 90 minutes and full supination 2 hours into the future. (Noting the weirdness that the left hand would be more past-oriented and the right hand more future-oriented.) Let’s call this controlled extents to distinguish it from auto-extents, discussed later.
What if -90/+180 minutes is not enough time to entail the object at hand? Or what if that’s way too much time? The scale of those extents could be modified by a second gesture, such as the distance of the left hand from the right. So when the left hand was very far back, the extents might be -90/+180 years. When the left hand was touching the right, the extents might be -90/+180 milliseconds to find detail in very fast moving events. This kind-of backworlds the gestures seen in the film.
That’s simple and quite powerful, but doesn’t wholly fit the content for a couple of reasons. The first is that the time scales can vary so much between objects. Even -90/+180 years might be insufficient. What if Strange was scrubbing the timeline of a Yareta plant (which can live to be 3,000 years old) or a meteorite? Things exist in greatly differing time scales. To solve that you might just say OK, let’s set the scale to accommodate geologic or astronomic time spans. But now to select meaningfully between the apple and the tome his hand must move mere nanometers and hard for Strange to get right. A logarithmic time scale to that slider control might help, but still only provides precision at the now end of the spectrum.
If you design a thing with arbitrary time mapping you also have to decide what to do when the object no longer exists prior to the time request. If Strange tried to turn the apple back 50 years, what would be shown? How would you help him elegantly focus on the beginning point of the apple and at the same time understand that the apple didn’t exist 50 years ago?
So letting Strange control the extents arbitrarily is either very constrained or quite a bit more complicated than the movie shows.
Could the extents be automatically set per the focus?
Could the extents be set automatically at the beginning and end of the object in question? Those can be fuzzy concepts, but for the apple there are certainly points in time at which we say “definitely a bud and not a fruit” and “definitely inedible decayed biomass.” So those could be its extents.
The extents for the tome are fuzzier. Its beginning might be when its blank vellum pages were bound and its cover decorated. But the future doesn’t have as clean an endpoint. Pages can be torn out. The cover and binding could be removed for a while and the pages scattered, but then mostly brought together with other pages added and rebound. When does it stop being itself? What’s its endpoint? Suddenly the Eye has to have a powerful and philosophically advanced AI just to reconcile Theseus’ paradox for any object it was pointed at, to the satisfaction of the sorcerer using it and in the context in which it was being examined. Not simple and not in evidence.
Auto-extents could also get into very weird mapping. If an object were created last week, each single degree of right-hand-pronation would reverse time by about 2 hours; but if was fated to last a millennium, each single degree of right-hand-supination would advance time by about 5 years. And for the overwhelming bulk of that display, the book wouldn’t change much at all, so the differences in the time mapping between the two would not be apparent to the user and could cause great confusion.
So setting extents automatically is not a simple answer either. But between the two, starting with the extents automatically saves him the work of finding the interesting bits. (Presuming we can solve that tricky end-point problem. Ideas?) Which takes us to the question of the best display, which I’ll cover in the next post.
The opening shot of Johnny Mnemonic is a brightly coloured 3D graphical environment. It looks like an abstract cityscape, with buildings arranged in rectangular grid and various 3D icons or avatars flying around. Text identifies this as the Internet of 2021, now cyberspace.
Strictly speaking this shot is not an interface. It is a visualization from the point of view of a calendar wake up reminder, which flies through cyberspace, then down a cable, to appear on a wall mounted screen in Johnny’s hotel suite. However, we will see later on that this is exactly the same graphical representation used by humans. As the very first scene of the film, it is important in establishing what the Internet looks like in this future world. It’s therefore worth discussing the “look” employed here, even though there isn’t any interaction.
Cyberspace is usually equated with 3D graphics and virtual reality in particular. Yet when you look into what is necessary to implement cyberspace, the graphics really aren’t that important.
MUDs and MOOs: ASCII Cyberspace
People have been building cyberspaces since the 1980s in the form of MUDs and MOOs. At first sight these look like old style games such as Adventure or Zork. To explore a MUD/MOO, you log on remotely using a terminal program. Every command and response is pure text, so typing “go north” might result in “You are in a church.” The difference between MUD/MOOs and Zork is that these are dynamic multiuser virtual worlds, not solitary-player games. Other people share the world with you and move through it, adventuring, building, or just chatting. Everyone has an avatar and every place has an appearance, but expressed in text as if you were reading a book.
guest>>@go #1914

Castle entrance

A cold and dark gatehouse, with moss-covered crumbling walls. A passage gives entry to the forbidding depths of Castle Aargh. You hear a strange bubbling sound and an occasional chuckle.


Obvious exits:

path to Castle Aargh (#1871)

enter to Bridge (#1916)
Most impressive of all, these are virtual worlds with built-in editing capabilities. All the “graphics” are plain text, and all the interactions, rules, and behaviours are programmed in a scripting language. The command line interface allows the equivalent of Emacs or VI to run, so the world and everything in itcan be modified in real time by the participants. You don’t even have to restart the program. Here a character creates a new location within a MOO, to the “south” of the existing Town Square:
laranzu>>@dig MyNewHome

laranzu>> @describe here as “A large and spacious cave full of computers”

laranzu>> @dig north to Town Square
The simplicity of the text interfaces leads people to think these are simple systems. They’re not. These cyberspaces have many of the legal complexities found in the real world. Can individuals be excluded from particular places? What can be done about abusive speech? How offensive can your public appearance be? Who is allowed to create new buildings, or modify existing ones? Is attacking an avatar a crime? Many 3D virtual reality system builders never progress that far, stopping when the graphics look good and the program rarely crashes. If you’re interested in cyberspace interface design, a long running textual cyberspace such as LambdaMOO or DragonMUD holds a wealth of experience about how to deal with all these messy human issues.
So why all the graphics?
So it turns out MUDs and MOOs are a rich, sprawling, complex cyberspace in text. Why then, in 1995, did we expect cyberspace to require 3D graphics anyway?
The 1980s saw two dimensional graphical user interfaces become well known with the Macintosh, and by the 1990s they were everywhere. The 1990s also saw high end 3D graphics systems becoming more common, the most prominent being from Silicon Graphics. It was clear that as prices came down personal computers would soon have similar capabilities.
At the time of Johnny Mnemonic, the world wide web had brought the Internet into everyday life. If web browsers with 2D GUIs were superior to the command line interfaces of telnet, FTP, and Gopher, surely a 3D cyberspace would be even better? Predictions of a 3D Internet were common in books such as Virtual Reality by Howard Rheingold and magazines such as Wired at the time. VRML, the Virtual Reality Markup/Modeling Language, was created in 1995 with the expectation that it would become the foundation for cyberspace, just as HTML had been the foundation of the world wide web.
Twenty years later, we know this didn’t happen. The solution to the unthinkable complexity of cyberspace was a return to the command line interface in the form of a Google search box.
Abstract or symbolic interfaces such as text command lines may look more intimidating or complicated than graphical systems. But if the graphical interface isn’t powerful enough to meet their needs, users will take the time to learn how the more complicated system works. And we’ll see later on that the cyberspace of Johnny Mnemonic is not purely graphical and does allow symbolic interaction.
Time traveling in the DeLorean is accomplished in three steps. In the first, he traveler turns on the “time circuits” using a rocking switch in the central console. Its use is detailed in the original Back to the Future, as below.
In the second, the traveler sets the target month, day, year, hour, and minute using a telephone keypad mounted vertically on the dashboard to the left, and pressing a button below stoplight-colored LEDs on the left, and then with an extra white status indicator below that before some kind of commit button at the bottom.
In the third, you get the DeLorean up to 88 miles per hour and flood the flux capacitor with 1.21 gigawatts of power.
Seems simple.
It’s not…
Rocker switch?
Note that the rocker switch angles down to a nearly 45 degree angle in the on position. One of the worst thing that could happen is for that thing to get accidentally turned off at the wrong time, I imagine. (Back to the Future 4: Lost in Somewhen?) The 45 degree angle makes an accidental activation unlikely, but the T-shaped handle means it could catch on a sleeve or bag handle or something. There are more secure safety switches, but I also wonder if it would be smarter to use the Fake Off mode that most electronics run in today, where they’re never really off, but look off, just waiting for user interaction to spring to life. With a Mr. Fusion on board, I presume powering it isn’t that much of a problem.
Good disambiguation
Note that the pad only has numbers. But Doc uses the military and European standard date format
[day of month] [month] [year]
which might confuse another user, i.e. Marty, entering the stupid USA standard
[month] [day of month] [year]
Though preventing errors is preferable, at least Doc helps Marty recognize errors by displaying the month in 3-character text format, which would help Marty realize if he’d accidentally put in 10 September instead of 09 October.
Bad disambiguation
Note that doc is traveling to 4:29 in the afternoon, and the display has a tiny LED A.M./P.M. indicator. Better is the less ambiguous military time. Sure, audiences might have been confused, but using a 24-hour clock would have been less ambiguous for diegetic users, you could eliminate the AM/PM indicator, and Doc could use the existing number pad for entry without having to either add an “AM” and “PM” button (missing from the console), or doing some annoying “press 1 for AM or 2 for PM now” IVR thing.
While we’re on time disambiguation, what, uh, time zone is this? Did doc only ever plan to fly in and around Hill Valley? It might have been keyed to the Prime Meridian, or to Pacific Time, but if so it would have been very useful to have it marked as such. If not, it should display the current time zone and provide a means to change it. Somehow. With that number pad. (Or more controls.)
Bad input constraint and recovery
It’s wholly possible to enter a day-of-month or month of “99,” which is nonsensical given the Gregorian calendar that we use today. How does the system handle this? A mod function? There’s no clue, but the unconstrained inputs would allow it.
Farther travel?
As the Long Now Foundation reminds us, a four-digit date is really short-sighted. So Doc didn’t want to travel to 10,000 C.E. and see if Zager & Evans were right? And what if he wanted to go meet Amenhotep? How does he specify 1526 B.C.E.? It seems unduly constrained.
Misleading mapping
I don’t know what those LEDs to the left of the input panel do, but I can tell they’re poorly mapped. The colors go, from top to bottom: red, yellow, and green, like a stoplight. Then there’s the extra white LED below that maps to nothing. But the LED colors on the display go from top to bottom red for destination, green for present, yellow for last time departed. Better mapping would have these two agree, or distinct color schemes.
Missing controls
In 1985 dialing a telephone number worked much like the dial-a-date seen here. Punch a sequence of numbers and the system runs with the input. But instant-input systems need a way to correct errors; either the ability to review and correct the input, or to abort the input altogether and start over.
Phone users from back then will recall it was entirely possible to mistype a digit and dial a wrong number. You’d be connected to a stranger who had no idea who this “Marty” you wanted was. This is more serious in the DeLorean than on a phone, as it drops the user into circumstances potentially much more dire, from which there might be no recovery. What would happen if they had accidentally wound up in 21 October 1015? Wholly different story. Is Biff distantly related to Cnut the Great?
Doc might be able to review the input on the display before getting up to speed, but there’s no obvious control for aborting input so far and starting over. (What if he has skipped a digit instead of mistyping one?) A simple delete button would help him correct mistyped digits. Even if he mistyped the first one and only realized it at the end, it wouldn’t be too burdensome to press delete the handful of times.
Rich preview
How does the system confirm for Doc that he’s entered the right date he intended to? On one level, sure, the 7-segment LED output is clear and unambiguous. It’s a nice discrete number. But of course 7-segment 1989 isn’t that easy to distinguish from 1898 when you’re distracted. Better would be to give a preview of the meaning of the choices entered (but not yet enacted) by the user. If there was a video screen in the car, then maybe it could show scenes from old Westerns with the label “Headed to 1898: The Old West.” You could even do it with the cars’ speakers and an audio soundscape if a screen wouldn’t work for space or distraction reasons.
Security
As noted in the overview, Biff(2015) gets into the car to make off for 1955 early in the film. I can’t quite figure out how he was able to figure out turning on the time circuit and that the 88MPH was a target speed, but he did. (Seriously, looking for fan theories here.) Of course Doc might have designed everything to be perfectly understandable for Marty, but that’s no excuse to avoid authenticating the user, since Doc is so panicked about the consequences of the time travel that he’s doing all the times. [sic]
The first computer interface we see in the film occurs at 3:55. It’s an interface for housing and monitoring the tesseract, a cube that is described in the film as “an energy source” that S.H.I.E.L.D. plans to use to “harness energy from space.” We join the cube after it has unexpectedly and erratically begun to throw off low levels of gamma radiation.
The harnessing interface consists of a housing, a dais at the end of a runway, and a monitoring screen.
Fury walks past the dais they erected just because.
The housing & dais
The harness consists of a large circular housing that holds the cube and exposes one face of it towards a long runway that ends in a dais. Diegetically this is meant to be read more as engineering than interface, but it does raise questions. For instance, if they didn’t already know it was going to teleport someone here, why was there a dais there at all, at that exact distance, with stairs leading up to it? How’s that harnessing energy? Wouldn’t you expect a battery at the far end? If they did expect a person as it seems they did, then the whole destroying swaths of New York City thing might have been avoided if the runway had ended instead in the Hulk-holding cage that we see later in the film. So…you know…a considerable flaw in their unknown-passenger teleportation landing strip design. Anyhoo, the housing is also notable for keeping part of the cube visible to users near it, and holding it at a particular orientation, which plays into the other component of the harness—the monitor.
The monitor
In the underground laboratory, an (unnamed?) technician warns lead scientist Selvig that, “it’s spiking again,” and the camera pans down to this monitoring interface.
Header
The header is a static barcode followed by the initialism J.D.E.M. along with its full name, the Joint Dark Energy Mission. (Sounds super cool and sci-fi, right? Turns out it is a real program between NASA and the US DOE.) Another label across the top identifies the screen as LEVEL 5 and that it belongs to PROJECT PEGASUS and NASA.
3D map
A main display shows a 3D wireframe of the tesseract, with color-coded nebula-like shapes within the cube. The wireframe (and most of the text on screen) are a bright cyan, with internal features progressing in color from the cyan through white to a blood red, all the way to lens flares near the most active areas in the cube. The color choices make for a quick read of what is “cool” and what is “hot,” so are effective for being immediate, but if the lens flares are designed into the system to indicate peakness, it’s a bad choice for obscuring other data in the display.
Note that the wireframe of the cube is also rotating slightly, which is very helpful for a user to more fully understand 3D information from a 2D screen. It might be even better mapping with less cognitive load if the display was a volumetric projection. (VPs exist within the Marvel Cinematic Universe (MCU), but so far I believe we’ve only ever seen them in Tony Stark’s possession so perhaps he has not released it to the outside world.) Hopefully in its rotation on this monitor it does not rotate in 360°, as the regularness of the cube would make it difficult to understand where an internal anomaly might exist in the real thing. Hopefully the wireframe only wavers back and forth within a few degrees, and is oriented in roughly the same way an observer glancing at the real thing would see it in the housing, to allow for instant mapping of problem areas.
Warning
Just to the left of the 3D map is a data monitoring panel. Its top label blinks a red WARNING CRITICAL ENERGY LEVELS and a percentage readout. The panel also features a key whose colors match those of the map. (As it should.) Hopefully a microinteraction allows a user to touch any part of the map, freeze the rotation, and get the percentage details of the touched point. A detail box wavers its vertical position along the key to provide a user a quick assessment of its value, and also contains a percentage readout for precision. Judging by the position of the box and the readout, it looks like the 100% mark is about halfway up the screen. Hopefully the upper part of the scale is logarithmic to accommodate massive surges in values.
Additional elements of the display include several scrolling waveforms and text boxes with inscrutable data and labels. It’s easy to imagine these as useful (say total energy values for specific electromagnetic frequencies) but they’re difficult to read, so difficult to formally evaluate.
All told, a nice display (per some assumptions) for monitoring what’s happening with the cube.
Now if only they had applied that solid design thinking to that dais vs. cage problem.
When the Odyssey needs to reverse thrust to try and counter a descent towards the TET, Jack calls for a full OMS (Orbital Maneuvering System) burn. We do not see what information he looks at to determine how fast he is approaching the TET, or how he knows that the OMS system will provide enough thrust.
The OMS system (4 large chemical thrusters up front)
A secondary set of thrusters (similar and larger than the OMS system) on the sleep module
Tiny chemical thrusters like those used to change current spacecraft yaw/pitch/roll (the shuttle’s RCS).
After Jack calls out for an OMS burn, Vika punches in a series of numbers on her keypad, and jack flips two switches under the keypad. After flipping the switches ‘up’, Jack calls out “Gimbals Set” and Vika says “System Active”.
Finally, Jack pulls back on a silver thrust lever to activate the OMS.
Why A Reverse Lever?
Typically, throttles are pushed forward to increase thrust. Why is this reversed? On current NASA spacecraft, the flight stick is set up like an airplane’s control, i.e., back pitches up, forward pitches down, left/right rolls the same. Note that the pilot moves the stick in the direction he wants the craft to move. In this case, the OMS control works the same way: Jack wants the ship to thrust backwards, so he moves the control backwards. This is a semi-direct mapping of control to actuator. (It might be improved if it moved not in an arc but in a straight forward-and-backward motion like the THC control, below. But you also want controls to feel different for instant differentiation, so it’s not a clear cut case.)
Source: NASA
What is interesting is that, in NASA craft, the control that would work the main thrusters forward is the same control used for lateral, longitudinal, and vertical controls:
Source: NASA
Why are those controls different in the Odyssey? My guess is that, because the OMS thrusters are so much more powerful than the smaller RCS thrusters, the RCS thrusters are on a separate controller much like the Space Shuttle’s (shown above).
And, look! We see evidence of just such a control, here:
Separating the massive OMS thrusters from the more delicate RCS controls makes sense here because the control would have such different effects—and have different fuel costs—in one direction than in any other. Jack knows that by grabbing the RCS knob he is making small tweaks to the Odyssey’s flight path, while the OMS handle will make large changes in only one direction.
The “Targets” Screen
When Jack is about to make the final burn to slow the Odyssey down and hold position 50km away from the TET, he briefly looks at this screen and says that the “targets look good”.
It is not immediately obvious what he is looking at here.
Typically, NASA uses oval patterns like this to detail orbits. The top of the pattern would be the closest distance to an object, while the further line would indicate the furthest point. If that still holds true here, we see that Jack is at the closest he is going to get to the TET, and in another orbit he would be on a path to travel away from the TET at an escape velocity.
Alternatively, this plot shows the Odyssey’s entire voyage. In that case, the red dotted line shows the Odyssey’s previous positions. It would have entered range of the TET, made a deceleration burn, then dropped in close.
Either way, this is a far less useful or obvious interface than others we see in the Odyssey.
The bars on the right-hand panel do not change, and might indicate fuel or power reserves for various thruster banks aboard the Odyssey.
Why is Jack the only person operating the ship during the burn?
This is the final burn, and if Jack makes a mistake then the Odyssey won’t be on target and will require much more complicated math and piloting to fix its position relative to the TET. These burns would have been calculated back on Earth, double-checked by supercomputers, and monitored all the way out.
A second observer would be needed to confirm that Jack is following procedure and gets his timing right. NASA missions have one person (typically the co-pilot) reading from the checklist, and the Commander carrying out the procedure. This two-person check confirms that both people are on the same page and following procedure. It isn’t perfect, but it is far more effective than having a single person completing a task from memory.
Likely, this falls under the same situation as the Odyssey’s controls: there is a powerful computer on board checking Jack’s progress and procedure. If so, then only one person would be required on the command deck during the burn, and he or she would merely be making sure that the computer was honest.
This argument is strengthened by the lack of specificity in Jack’s motions. He doesn’t take time to confirm the length of the burn required, or double-check his burn’s start time.
If the computer was doing all that for him, and he was merely pushing the right button at the indicated time, the system could be very robust.
This also allows Vika to focus on making sure that the rest of the crew is still alive and healthy in suspended animation. It lowers the active flight crew requirement on the Odyssey, and frees up berths and sleep pods for more scientific-minded crew members.
Help your users
Detail-oriented tasks, like a deceleration burn, are important but let’s face it, boring. These kinds of tasks require a lot of memory on the part of users, and pinpoint precision in timing. Neither of those are things humans are good at.
If you can have your software take care of these tasks for your users, you can save on the cost of labor (one user instead of two or three), increase reliability, and decrease mistakes.
Just make sure that your computer works, and that your users have a backup method in case it fails.
In addition to easy sex and drugs, citizens of Dome City who are either unhappy or even just bored with the way they look can stop by one of the New You salons for a fast, easy cosmetic alternation.
At the salon we get a glimpse of an interface a woman is using to select new facial features. She sits glancing down at a small screen on which she sees an image of her own face. A row of five unlabeled, gray buttons are mounted on the lower bevel of the screen. A black circle to the right of the screen seems to be a camera. She hears a soft male voice advising, “I recommend a more detailed study of our projections. There are new suggestions for your consideration.”
She presses the fourth button, and the strip of image that includes her chin slides to the right, replaced with another strip of image with the chin changed. Immediately afterwards, the middle strip of the image slides left, replaced with different cheekbones.
In another scene, she considers a different shape of cheekbones by pressing the second button.
So. Yeah. Terrible.
The first is poor mapping of buttons to the areas of the face. It would make much more sense, if the design was constrained to such buttons, to place them vertically along the side of the screen such that each button was near to the facial feature it will change.
Labels would help as well, so she wouldn’t have to try buttons out to know what they do (though mapping would help that.)
Another problem is mapping of controls to functions. In one scene, one button press changes two options. Why aren’t these individual controls?
Additionally, if the patron is comparing options, having the serial presentation places a burden on her short term memory. Did she like the apple cheeks or the modest ones better? If she is making her decision based on her current face, it would be better to compare the options in questions side-by-side.
A frontal view isn’t the only way her new face would be seen. Why does she have to infer the 3D shape of the new face from the front view? She should be able to turn it to any arbitrary angle, or major viewing angles at once, or watch videos of her moving through life in shifting light and angle conditions, all with her new face on.
How many options for each component are there? A quick internet search showed, for noses, types show anything between 6 and 70. It’s not clear, and this might change how she makes her decision. If it’s 70, wouldn’t some subcategories or a wizard help her narrow down options?
Recovery. If she accidentally presses the wrong button, how does she go back? With no labeling and an odd number of buttons to consider, it’s unclear in the best case and she’s forced to cycle through them all in the worst.
The reason for the transition is unclear. Why not a jump cut? (Other than making sure the audience notices it.) Or a fade? Or some other transition.
Why isn’t it more goal-focused? What is her goal in changing her face? Like, can she elect to look more like a perticular person? Or what she thinks her current object of affection will like? (Psychologically quite dystopian.) Or have her face follow current face fashion trends? Or point out the parts of herself that she doesn’t like? Or randomize it, and just “try something new?”
OK I guess for both showing how easy cosmetic surgery is in the future, and how surface Dome City’s residents’ concepts of beauty are, this is OK. But for actual usability, a useless mess.
The stage managers’ main raison d’être is to course-correct if and when victims begin to deviate from the path required of the ritual.
This begins with the Prep team, long before the victims enter the stage. For example, Jules’ hair dye and Marty’s laced pot. These corrections become more necessary and intense once the victims go on stage.
Making sure there are sexy times
The ritual requires that a sexy young couple have sexy times on stage before they suffer and die. “The mood” can be ruined by many things, but control has mechanisms to cope with most of them. We see three in the movie.
Temperature
The temperature can’t be too hot or too cold, but this isn’t something that can be set and forgot. What counts as the right temperature is a subjective call for the people involved and their circumstances, such as being drunk, or amount and type of clothes worn. Fortunately, the video-audio panopticon lets the stage managers know when a victim speaks about this directly, and do something about it. The moment Jules complains, for instance, Sitterson is able to reach over to a touch-screen display and tap the temperature a few degrees warmer.
Sitterson heats things up.
The gauge is an interesting study. It implies a range possible between 48 and 92 degrees Fahrenheit, each of which is uncomfortable enough to encourage different behaviors in the victims, without the temperature itself being life-threatening.
Moreover, we see that it’s a “blind” control. Before Sitterson taps it, he is only shown the current temperature as a blue rectangle that fills up four bars and that it is exactly 64 degrees. But if he knew he wanted it to be 76 degrees, what, other than experience or training, tells him where he should touch to get to that desired new temperature? Though the gauge provides immediate feedback, it still places a burden on his long-term memory. And for novice users, such unlabeled controls require a trial-and-error method that isn’t ideal. Even the slim area of white coloring at the top, which helpfully indicates temperatures warmer than cooler, appears too late to be useful.
Better would be to have the color alongside or under the gauge with smaller numbers indicated along its length such that Sitterson could identify and target the right temperature on the first try.
Libido
The next thing that can risk the mood is a lack of a victim’s amorous feelings. Should someone not be “feeling it,” Control can pipe sex pheromones to areas on stage. We see Hadley doing this by operating a throttle lever on the electronic-era control panel. After Hadley raises this lever, we see small plumes of mist erupt from the mossy forest floor that Jules and Curt are walking across.
Hadley introduces pheromones to the forest air.
This control, too, is questionable. Let’s first presume it’s not a direct control, like a light switch, but more of a set-point control, like a thermostat. Similar to the temperature gauge above, this control misses some vital information for Hadley to know where to set the lever to have the desired amount of pheromone in the air, like a parts-per-million labeling along the side. Perhaps this readout occurs on a 7-segment readout nearby or a digital reading on some other screen, but we don’t see it.
There is also no indication about how Hadley has specified the location for the pheromone release. It’s unlikely that he’s releasing this everywhere on stage, lest this become a different sort of ritual altogether. There must be some way for him to indicate where, but we don’t see it in use. Perhaps it is one of the lit square buttons to his right.
An interesting question is why the temperature gauge and pheromone controls, which are similar set-point systems, use not just different mechanisms, but mechanisms from different eras. Certainly such differentiation would help the stage managers’ avoid mistaking one for the other, and inadvertently turn a cold room into an orgy, so perhaps it is a deliberate attempt to avoid this kind of mistake.
Lights
The final variable that stands in the way of Jules’ receptiveness (the authors here must acknowledge their own discomfort in having to write about this mechanistic rape in our standard detached and observational tone) is the level of light. After she complains that it is too dark, Hadley turns a simple potentiometer and the “moonlight” on a soft bed of moss behind them grows brighter.
Control responds to Jules’ objection to the darkness.
This, too, is a different control than the others; though it controls what is essentially a floating-point variable. But since it is more of a direct control than the other two, its design as a hard-stop dial makes sense, and keeps it nicely differentiated from the others.
Marty’s Subliminal Messages
Over the course of the movie, several times we hear subliminal messages spoken to directly control Marty. We never see the inputs used by Control, but they do, at least on one occasion, actually influence him, and is one of the ways the victims are nudged into place.
Marty breaks the fourth wall
In addition to Dana & Curt’s almost not getting it on, another control-room panic moment comes when Marty accidentally breaks a lamp and finds one of the tiny spy cameras embedded throughout the cabin. Knowing that this level of awareness or suspicion could seriously jeopardize the scenario, Hadley bolts to a microphone where he says, “Chem department, I need 500 ccs of Thorazine pumped into room 3!”
Marty finds a spy camera
Hadley speaks a command to the Chem department
Careful observers will note while watching the scene that a menu appears on a screen behind him as he’s stating this. The menu lists the following four drugs.
Cortisol (a stress hormone)
Pheromones (a category of hormonal social signals, most likely sex pheromones)
Thorazine (interestingly, an antipsychotic known to cause drowsiness and agitation)
Rhohyptase (aka Rhohypnol, the date rape drug)
Given that content, the timing of the menu is curious. It appears, overlaid on the victim monitoring screen, the moment that Hadley says “500.” (Before he can even specify “Thorazine.”) How does it appear so quickly? Either there’s a team in the Chem department also monitoring the scene, and who had already been building a best-guess menu for what Hadley might want in the situation and they just happened to push it to Hadley’s screen at that moment; Or there’s an algorithmic voice- and goal-awareness system that can respond quickly to the phrase “500 ccs” and provide the top four most likely options. That last one is unlikely, since…
We don’t see evidence of it anywhere else in the movie
Hadley addresses the Chem department explicitly
We’d expect him to have his eyes on the display, ready to make a selection on its touch surface, if this was something that happened routinely
But, if we were designing the system today with integrated voice recognition capabilities, it’s what we’d do.
Curt suggests they stick together
After the attack begins on the cabin itself, Curt wisely tells the others, “Look, we’ve got to lock this place down…We’ll go room by room, barricade every window and every door. We’ve got to play it safe. No matter what happens, we have to stay together.” Turns out this is a little too wise for Hadley’s tastes. Sitterson presses two yellow, back-lit buttons on his control panel to open vents in the hallway, that emit a mist. As Curt passes by the vents and inhales, he pauses, turns to the others and says, “This isn’t right…This isn’t right, we should split up. We can cover more ground that way.”
Sitterson knocks some sense out of Curt.
This two-button control seems to indicate drug (single dose) and location, which is sensible. But if you are asking users to select from different variables, it’s a better idea to differentiate them by clustering and color, to avoid mistakes and enable faster targeting.
Locking the doors
Once the victims are in their rooms, Hadley acknowledges it’s time to, “Lock ‘em in.” Sitterson flips a safety cover and presses a back-lit rocker switch, which emits a short beep and bolts the doors to all the victims’ rooms at the same time.
Sitterson bolts the victims’ doors.
Marty in particular notices the loud “clunk” as the bolts slide into place. He tests the door and is confounded when he finds it is, in fact, locked tight. Control’s earlier concern about tipping their hand seems to matter less and less, since this is a pretty obvious manipulation.
The edge of the world
Bolted doors pale in comparison to the moment when Curt, Dana, and Holden violently encounter the limits of the stage. After the demolition team seals the tunnel to prevent escape that way, Curt tries to jump the ravine to the other side so he can fetch help. Unfortunately for him, the ravine is actually an electrified display screen, showing a trompe-l’œil illusion of the far side. By trying to jump the ravine, Curt unwittingly commits suicide by slamming into it.
Curt slams into the edges of the “world” of the cabin.
The effect of the screen is spectacular, full of arcs zipping along hexagonal lines and sparks flying everywhere. Dana and Holden rush to the edge of the cliff to watch him tumble down its vast, concave surface. It seems that if you’ve come this far, Control isn’t as concerned about tipping its hand as it is finishing the job.


 Caveat #1: As a public service I have included some information about COVID-19 in the body of the post with a link to sources. These are called out the way this paragraph is, with a SARS-CoV-2 illustration floated on the left. I have done as much due diligence as one blogger can do to not spread disinformation, but keep in mind that our understanding of this disease and the context are changing rapidly. By the time you read this, facts may have changed. Follow links to sources to get the latest information. Do not rely solely on this post as a source. If you are reading this from the relative comfort of the future after COVID-19, feel free to skip these.


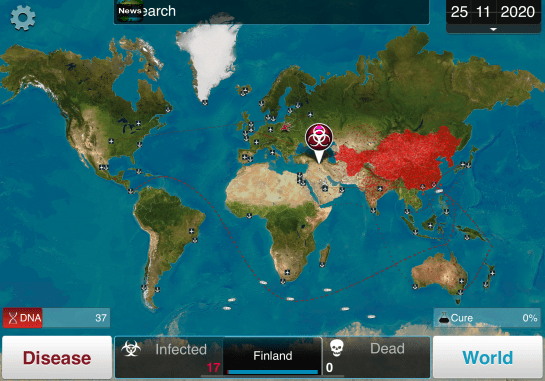


