To date, the #GenderedAI study spans many posts, lots of words and some admittedly deep discussion. If you’re a visual person like me, sometimes you just want to see a picture. So, I made an infographic. It’s way too big for WordPress, so you’ll have to peruse this preview and head over to IMGUR to scroll through the full-size thing in all its nerdy glory. (https://imgur.com/k6wtuop) That site does marvelously with long, tall images.
Anyway this should make it easy to grok the big takeaways from the study and to share on social media so more people can get sensitized to these issues. Also… (more below)
In 8th grade, I went on our class trip to Washington D.C. The hotel we were staying at had kids from all over the country, and one night they held a dance. I had changed into sweats and a t-shirt and was dancing away with my friends when a boy walked up behind me, tapped me on the shoulder, and said, “Fairy!”
“I think we both know the answer to that.” —Cortana, Halo: Combat Evolved
When I turned around and the boy realized I was a girl, he got a confused look on his face, mumbled something and walked off. I was left feeling angry and hurt.
Humans have a strong pull to identify gender not just in people, but in robots, animals, and even smart speakers. (Whether that is wrong or right is another matter that I don’t address here, but many people are uncomfortable when gender is ambiguous.)
Even robots, which could easily be genderless, are assigned a gender.
Author Chris Noessel has accumulated an amazing set of data which looks at hundreds of characters in science fiction, and has found that, among many other things, of the 327 AI characters he looked at, about twice as many are male as female.
Social Gender
Noessel has further broken down gender assignment into types: social, bodily, and biological. I find the “social” category particularly interesting, which he defines as follows:
Characters are tagged as socially male or female if the only cues are the voice of the actor or other characters use gendered pronouns to refer to it. R2D2 from Star Wars, for example, is referred to as “him” or “he” many times, even though he has no other gender markers, not even voice. For this reason, R2D2 is tagged as “socially male.”
Disturbingly, Noessel found that the gender ratio was skewed most for this category, at 5 male characters for every 1 female.
I believe that much of the time, when writers create an AI character, it is male by default, unless there is something important about being female. For example, if the character is a love interest or mother, then it must be female; otherwise, by default, it’s male. This aligns with the “Men Are Generic, Women Are Special” theory from TV Tropes, which states:
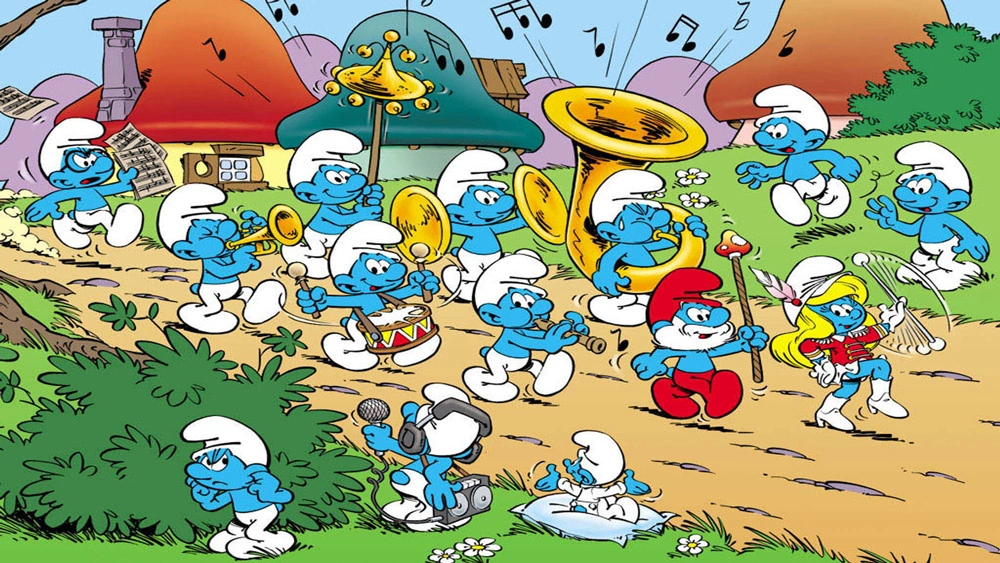
This leads to the Smurfette Principle, in which a character’s femaleness is the most important and interesting thing about her, often to exclusion of all else. It also tends to result in works failing The Bechdel Test, because if there’s a potential character who doesn’t have to be any particular gender, the role will probably be filled by a male character by default.
Having been designing and researching voice interfaces for twenty years, I’d like to add some perspective on how gender and AI is applied to our current technology.
In the real world
One exception to this rule is voice assistants, such as Siri, Cortana, and Alexa. The majority of voice assistants have a female voice, although some allow you to change the default to a male voice. On the other hand, embodied robots (such as Jibo (pictured below), Vector, Pepper, and Kuri) are more often gendered as male.
When a robot is designed, gender does not have to be immediately assigned. In a voice assistant, however, it’s the most apparent characteristic.
In his book Wired for Speech, Clifford Nass wrote that individuals generally perceive female voices as helping us solve our problems by ourselves, while they view male voices as authority figures who tell us the answers to our problems.
If voice-only assistants are predominantly given female voices, why are robots any different?
Why are robots different?
One reason is androcentrism: the default for many things in society is male, and whatever differs from that default must be marked in some way. When people see a robot with no obviously “female” traits (such as long hair, breasts, or, in the case of Rosie from the Jetsons, an apron) they usually assign a male gender, as this study found. It’s similar for cartoons such as stick figures, and animals in animated movies. Animals are often given unrealistic bodies (such as a nipped-in waist), a hairbow, or larger, pink lips to “mark” them as female.
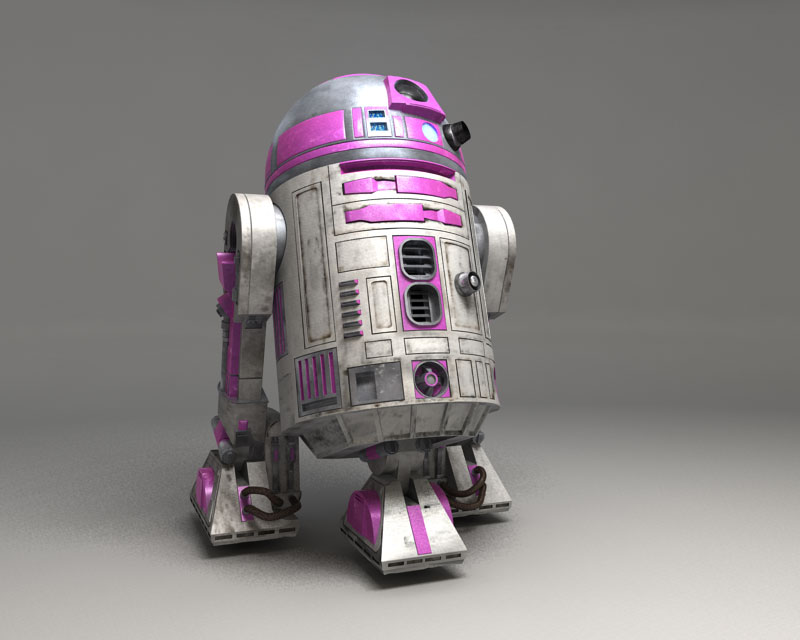
It would not be surprising if designers felt that to make a robot NOT male, they would have to add exaggerated features. Imagine if, after R2D2 was constructed, George Lucas said “let’s make R2D2 female”. Despite the fact that nothing would have to be changed (apart from the “he” pronoun in the script), I have no doubt the builders would have scrambled to “female-ize” R2D2 by adding a pink bow or something equally unnecessary.
“There. Perfect!” (This is actually R2-KT. Yes, she was created to be the female R2-D2.)
In addition, male characters in fictional works are often more defined by their actions, and female characters by their looks and/or personalities. In this light, it makes sense that a more physical assistant would be more likely to be male.
There are some notable exceptions to this, mainly in the area of home health robots (such as Mabu). It is interesting to note that Mabu, though “she” has a physical form, the body doesn’t move, just the head and eyes; it serves mainly as a holder for an iPad. Again, she’s an assistant.
So what?
One may ask, what’s the harm in these gendered assistants? One problem is the continued reinforcement of women as always helpful, pleasant, organized, and never angry. They’re not running things; they’re simply paving the way to make your life easier. But if you want a computer that’s “knowledgeable”—such as IBM’s Watson that took on the Jeopardy! Challenge—the voice is male. These stereotypes have an impact on our relationships with real people, and not for the better. There shouldn’t be a “default” gender, and it’s time to move past our tired stereotypes of women as the gender that’s always helpful and accommodating.
As fans of sci-fi, we should become at least sensitized, and more hopefully, vocal and active, about this portrayal of women, and do our part to create more equal technology.
My donation
Thanks to all who donated to compensate underrepresented voices! I am donating the monies I’ve received to the Geena Davis Institute on Gender in Media. This group “is the first and only research-based organization working within the media and entertainment industry to engage, educate, and influence content creators, marketers and audiences about the importance of eliminating unconscious bias, highlighting gender balance, challenging stereotypes, creating role models and scripting a wide variety of strong female characters in entertainment and media that targets and influences children ages 11 and under.” Check them out.
Men are more often masters of female AIs. Women are more often masters of non-bindary AIs. Male AIs shy away from having women masters. No, really.
This last correlations post investigates the complicated question of which genders are assigned when gender is not germane to the plot. If you haven’t read the series intro, related germane-ness distributions, or correlations 101 posts, I recommend you read them first. As always, check out the live Google sheet for the most recent data.
Recall from the germane distribution post that the germane tag is about whether the gender is important to the plot. (Yes, it’s fairly subjective.)
If an AI character makes a baby via common biological means, or their sex-related organs play a critical role, then the gender of the character is highly germane. Rachel in the Blade Runner franchise gestates a baby, so her having a womb is critical, and as we’ve seen in the survey, gender stacks, so her gender is highly germane.
If an AI character has a romantic relationship with a mono-sexual partner, or is themselves mono-sexual, or they occupy a gendered social role that is important to the plot, the characters is listed as slightly germane. For example, all you’d have to do is, say, make Val Com bisexual or gay, and then they could present as female and nothing else in the plot of Heartbeeps would need to change to accommodate it.
If the character’s gender could be swapped to another gender and it not change the story much, then we say that the character’s gender is not germane. BB-8, for instance, could present as female, and nothing in the canon Star Wars movies would change.
Yes, this matters.
I need to clarify that I’m talking about plot—what happens in the show—rather than story—which entails the reasons it is told and effects—because given the nature of identity politics, a change in gender presentation would often change how the story is received and interpreted by the audience.
All the characters in Alien, for instance, were written unisex, to be playable by actors of any sex or gender presentation. So while it “didn’t matter” that Ripley was cast as Sigourney Weaver, it totally did matter because she was such a bad-ass female character whose gender was immaterial to the plot (we hadn’t had a lot of those at this point in cinematic history). She was just a bad-ass who happened to be female, not female because she “needed” to be. So, yes, it does matter. But diegetically, had she been Alan Ripley, the plot and character relationships of Alien would not need to change. He still damned well better save Jonesy.
So what do we see when we look at the germane-ness of AI characters in a mostly-binary way?
Sure enough, when gender matters to the plot—slightly or highly—the gender presentation of the character is 5.47% female, or about 7% more likely than presenting male. When the gender presentation does not matter, that value is flipped, being around 7% more male than female, and around 9% more other than female.
The sample size for highly germane is vanishingly small, and one would expect the coupling to include a male, so the under-noise values for that category is not too surprising. But the other categories. Holy cow.
Put another way…
AI characters more often present as female only when they need to be.
Otherwise, they’re more often male or not gendered at all.
That is shitty. It’s like Hollywood thinks men are the default gender, and I know I just said it, but I’m going to stay it again—that’s shitty. Hey, Hollywood. Women are people.
Barbarella (female-presenting human) is master of Alphy (an AI whose voice presents male.) This is, statistically, an unlikely and unrepresentative relationship, but spot on for the late 01960s-feminist bent of Barbarella.
You may be wondering how this is different than the earlier subservience posts. Recall that the subservience studies look at gender presentation of AI as it relates to their own degree of freedom. Are most AIs freewilled? Yes. Do free-willed AI tend to present as boys more often than as girls or other? Yes. But these tell us nothing about the gender relationship of the subservient AIs to their master’s gender. It would be one thing if all the male-presenting AIs were “owned” by male-presenting owners. If would be another if female-presenting AIs were owned much more often by male-presenting masters. This post exposes those correlations in the survey. Chart time!
Data nerds (high fives) may note that unlike every other correlations chart in the series, these numbers don’t balance. For instance, looking at the Male AI in the left chart, -1.63 + 3.97 + 3.97 = 6.31. Shouldn’t they zero out? If we were looking at the entire survey, they would. But in this case, free-willed AI only muddy this picture, so those AIs are omitted, making the numbers seem wonky. Check the live sheet if you’re eager to dig into the data.
This is two charts in one.
The left chart groups the data by genders of master. Turns out if you have a female-presenting master, you are unlikely to be male- or female-presenting. (Recall that there are only 5 female-presenting masters in the entire Gendered AI survey, so the number of data points is low.) If you present as male, you’re more likely to be master of a gendered AI. Otherwise, you are more likely to be master of a male-presenting AI.
Your AI may not be happy about it, though.
The right chart is the same data, but pivoted to look at it from genders of AI. That’s where the clusters are a little more telling.
If you are a female-presenting AI, you are more likely to have a male-presenting master.
If you are non-binary AI, you are more likely to have a female-presenting master.
If you are a male AI, you have anything but a female-presenting master.
The detailed chart doesn’t reveal anything more than we see from this aggregate, so isn’t shown.
The notion of people owning people is revolting, but the notion of owning an AI is still not universally reviled. (With nods to the distinctions of ANI and AGI.) That means that sci-fi AI serves as unique metaphor for taboo questions of gender and ownership. The results are upsetting for their social implications, of course. And sci-fi needs to do better. Hey, maybe this gives you an idea…
And yet this isn’t the most upsetting correlations finding in the study. I saved that for last, which is next, which is when we look at gender and germaneness. Gird your loins.
The Gendered AI series looks at sci-fi movies and television to see how Hollywood treats AI of different gender presentations. For example, do female-presenting AIs get different bodies than male-presenting AIs? (Yes.) Are female AIs more subservient? (No.) What genders are the masters of AI? This particular post is about gender and goodness. If you haven’t read the series intro, related goodness distributions, or correlations 101 posts, I recommend you read them first. As always, check out the live Google sheet for the most recent data.
n.b. If you’re looking at the live sheet, you may note it says “alignment” rather than “goodness” in the dropdown and sheets. Sorry about the D&D roots showing. But by this, I mean a rough, highly debatable scale of saintliness to villainy.
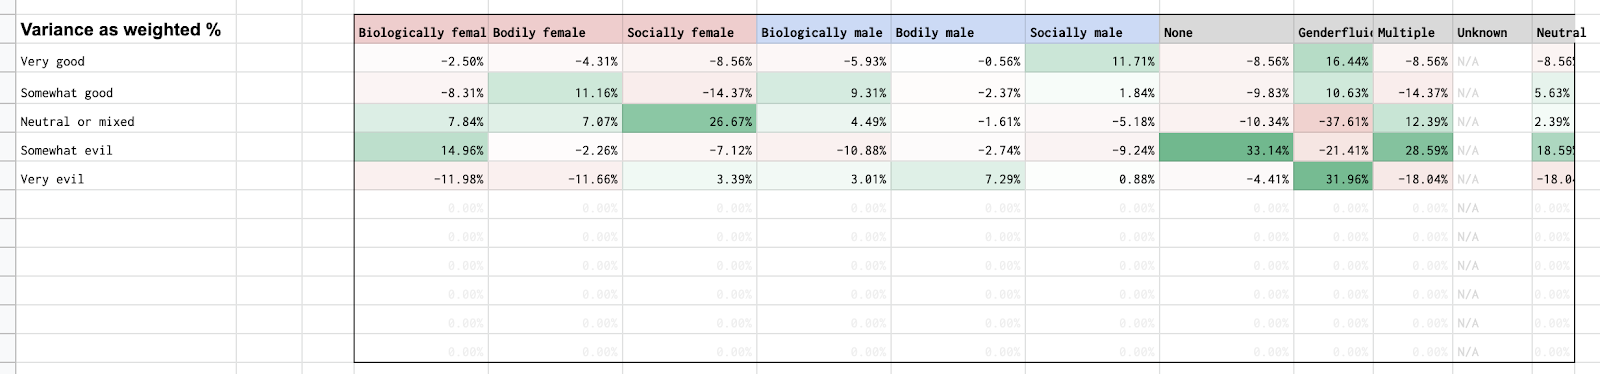
Gender and goodness
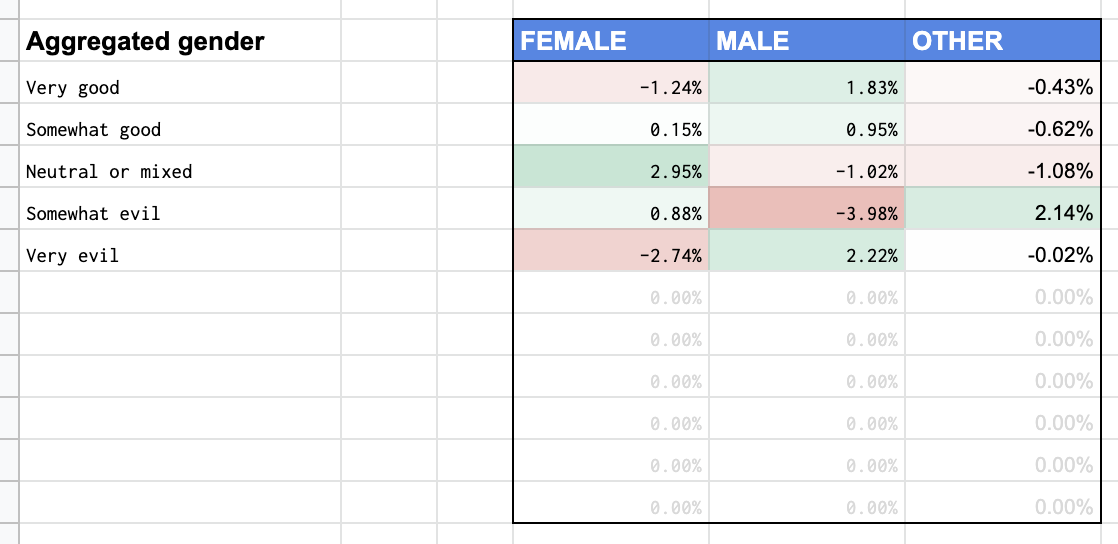
What do we see when we look at the correlations of gender and level of goodness? There are three big trends.
The aggregate picture shows a tendency for female-presenting AI’s to be closer to neutral, rather than extreme.
It shows a tendency for male-presenting AI’s to be very good, or very evil.
It shows a slight tendency for nonbinary-presenting AI to be slightly evil, but not full-bore.
When we look into the detailed chart, some additional trends appear.
Biologicially- and bodily-presenting female AI tends toward somewhat evil, but not very evil.
Socially female (voice or pronouns, only) tend toward neutral.
Gender-less AI spike at somewhat evil.
Genderfluid characters (noting that this occurs mostly as a tool of deception) spike at very evil, like, say, Skynet.
AIs showing multiple genders tend toward neutral, like Star Trek TOS’s Exo III androids, or somewhat evil, like Mudd’s androids.
The Gendered AI series looks at sci-fi movies and television to see how Hollywood treats AI of different gender presentations. For example, are female AIs generally shown as smarter than male AIs? Are certain AI genders more subservient? What genders are the masters of AI? This particular post is about gender and category of intelligence. If you haven’t read the series intro, related category distributions, or correlations 101 posts, I recommend you read them first. As always, check out the live Google sheet for the most recent data.
What do we see when we look at the correlations of gender and level of intelligence? First up, the overly-binary chart, and what it tells us.
Gender and AI Category
You’ll recall that levels of AI are one of the following…
Super: Super-human command of facts, predictions, reasoning, and learning. Technological gods on earth.
General: Human-like, able to learn arbitrary new domains to human-like limits
Narrow: Very smart in a limited domain, but unable to learn arbitrary new domains.
The relationships are clear even if the numbers are smallish.
When AI characters are of a human-like intelligence, they are more likely to present gender.
When AI characters are either superintelligent or only displaying narrow intelligence, they are less likely to present gender.
My feminist side is happy that superintelligences are more often female and other than male, but it’s also such small numbers that it could be noise.
If you check the details in the Sheet, you’ll see the detailed numbers don’t reveal any more intense counterbalancing underneath the wan aggregate numbers.
Chris: I posted a question on Twitter, “Other than that SNL skit, have there been queer sci-fi AI in television or movies?” Among the responses is this awesome one from Terence Eden, where he compiled the answers and wrote a whole blog post about it. The following is slightly-modified from the original post on his blog. Consider this a parade of sci-fi AI, to help you nerds celebrate Pride.
Terence: Let’s first define what we mean by queer. This usually means outside of binary gender and/or someone who is attracted to the same sex—what’s commonly referred to as LGBT+. Feel free to supply your own definition.
As for what we mean by AI, let’s go with “mechanical or non-biological autonomous being.” That’s probably wide enough—but do please suggest better definitions.
So is a gay/lesbian robot one who is attracted to other robots? Or to humans with a similar gender? Let’s go with yes to all of the above.
Wait. Do robots have gender?
Humans love categorising things – especially inanimate objects. Some languages divide every noun into male a female. Why? Humans gonna human.
The television is female in French —“la télévision”—but masculine in German—“der Fernseher.” Stupid humans and their pathetic meaty brains. Nevertheless, humans can usually look at a human-ish thing and assign it a specific gender.
Maschinenmensch, from Metropolis, is a gynoid (as distinct from an android). “She” has a feminine body shape and that’s enough for most people to go on.
HAL from 2001 is just a disembodied voice. But it definitely has a male voice. Is there any attraction between HAL and Dave? I doubt it, but it’s an interesting reading of their toxic relationship.
Editor’s note: The whole Gendered AI series is predicated on the question of gender in sci-fi AI, so if you’re interested in this question, have I got a series for you…
Wait. Do Robots have sexuality?
Did we mention that humans love categorizing everything? Just like we can speak of the gender presentation, robots with a General AI can have romantic affection for other beings, and depending on their equipment and their definitions of sex, yes, get it on. Even by narrow human common definitions of gender and sexuality, (TV, movies, and comic book) sci-fi has a dozen or so examples that can populate our imaginary AI pride parade.
Kryten from Red Dwarf is an AI that receives a human body. Kryten coded as male. All the characters refer to him with male pronouns. Under British comedy rules, he is also “camp,” an over-the-top and stereotypically effeminate man. Kryten is sexually attracted to household appliances.
But… Kryten’s “perfect mate” is a distinctly female Gynoid, so he’s something other than straight, something other than appliance-sexual.
Fun fact: Camille and Kryten are played by real-life wife and husband Judy Pascoe and Robert Llewelyn!
C-3P0—another British campbot—is arguably in love with R2-D2. Whether or not that love is reciprocated is hard to say.
(I say “ladies,” but for the record let’s note that just because a robot is pink, wearing bobby socks, and a high heels, it doesn’t necessarily mean it’s a girl. If you’re looking for a pink R2 unit that is expressly a girl, check out the real-world KT-10 robot.)
In the “extended universe” of Transformers (outside of movies and television), there are a few gay Autobots and gay Decepticons.
Tigatron and Airazor. They even kind of had a baby.
Knock Out and Breakdown.
And of course there’s no denying that a few of the Futurama bots have tastes that veer from the straight and narrow. Notably we can point to that one time Hedonismbot stole Bender’s antenna and used it for “anything and everything,” said while in a sex dungeon surrounded by couples of every stripe who are getting it on.
“You might want to sterilize that.”
The “Robots attracted to humans of the same sex” float
There are several examples of “female” computers falling in love with male humans, a handful of male robots with female human lovers, and a disturbing number of sex-worker bots, but it is much harder to find queer examples of any of these.
The Tick show has a superhero named Overkill whose sidekick is an AI named Danger Boat that is, yes, housed in a boat. (Hat tip to Twitter user @FakeUnicode.) The AI identifies as male and is expressly attracted to other men, specifically The Tick’s (human) sidekick Arthur.
Is Danger Boat programmed to be gay? Are his desires hardwired? Are yours?
Remember Alien: Resurrection? Winona Ryder played the robot “Call” who has a suggestive relationship with Ripley. As this ship video demonstrates.
Battlestar Galactica has some demonstrably bisexual Cylons. They are sexually compatible and interested in humans and other Cylons.
Is Rachael from Blade Runner a robot, or bisexual?
Clearly, yes.
How about Samantha from Her? Late in the movie she reveals to Theodore that she’s having intimate conversations with 621 other humans. Some portion of them must have turned romantic and even sexual, as hers did with Theodore himself. The genders aren’t mentioned, but the odds are that 51% of them are female.
Unfortunately she has no embodiment, but maybe we can hook her up to the loudspeakers.
The Transexual Float
This float only has one robot, (the poorly-named) Hermaphrobot from Futurama, but she is sassy and awesome and assuring us that we couldn’t afford it. (And apologies for the insulting title added by the person who uploaded this video.) We are wholly unsure of Hermaphrobot’s sexuality, but we welcome our transexual robot brothers and sisters and others all and the same.
The GenderFluid Float
It’s possible for you to swap the gender of your Voice Assistant in real life. Your GPS can have a male voice one day, and you can swap it to female the next. There’s only one example of a sci-fi AI that swaps gender.
It takes us back to Red Dwarf again. In the series 3 opener “Backwards” it is revealed that Holly (a computer with a male face) fell in love with Hilly (a computer with a female face). And subsequently performed a head sex change. Although she kept the name Holly.
What is awesome and instructive is that the entire crew of Red Dwarf accept this. They never comment on it, nor disparage her. Basically, what I’m saying is this: if you can’t accept your trans and non-binary friends, you’re literally a worse human than Arnold Judas Rimmer, the worst human in the Red Dwarf universe.
Oh, look, and here comes The Fifth Elementfloor sweeping robots, picking up all the glitter and source code left on the ground by the crowd, marking the end of the AI Pride parade. Happy Pride to everyone, silicon or not!
The Gendered AI series looks at sci-fi movies and television to see how Hollywood treats AI of different gender presentations. For example, are female AIs given a certain type of body more than male AIs? Are certain AI genders more subservient? What genders are the masters of AI? This particular post is about gender and subservience. If you haven’t read the series intro, related subservience distributions, or correlations 101 posts, I recommend you read them first. As always, check out the live Google sheet for the most recent data.
Recall from the distributions post that subservience is cruder than we would like. Part of what we’re interested in is the social subservience: specifically whether female-presenting AI more often demur or take a deferential, submissive tone. The measurements I show here are more coarse than that, because the nuanced measurements are very open to debate, and can change over the course of a show. What I felt confident about tagging was first free-willed vs. subservient; and then, for those that had to obey a master, whether they could only act as instructed (slavish), whether they seemed to register and resist their servitude (reluctant) or not (improvisational). Still, even with the crude metric, there’s stuff to see.
What do we see when we look at the correlations of gender and subservience? First up, the trinary chart, and what it tells us.
The numbers are small here, at a max of 4.1% away from perfect, but we can still note the differences.
If it is free-willed, it is slightly more likely to be male than female, and male much more than other.
If it has a master, but free to improvise actions within constraints and orders, it is more likely to be other than male: ungendered (the majority), multi-gendered, or genderfluid.
Female-presenting AI do not appear to have significant disproportions of subservience. Those pink bars are all pretty small, all hovering near perfect distribution, and the one place they’re not, that is, slavish obedience, they’re less represented. Those characters tend to have a machine embodiment and therefore no gender, but it still means there is no bias toward or against female-presenting AIs in this correlation.
Now this probably breaks your gut sense of what you’ve seen in shows. What about Ex Machina! What about Maria! What about Ship’s computer in Star Trek? What about…? I’m not sure what to tell you, as these results thwart my expectations as well. But these are the numbers. It may just be that those examples of subservient female sci-fi AIs stand out for us more, given oppressive norms in the real world.
There’s not a lot more to be pulled from the detailed view of the data, either.
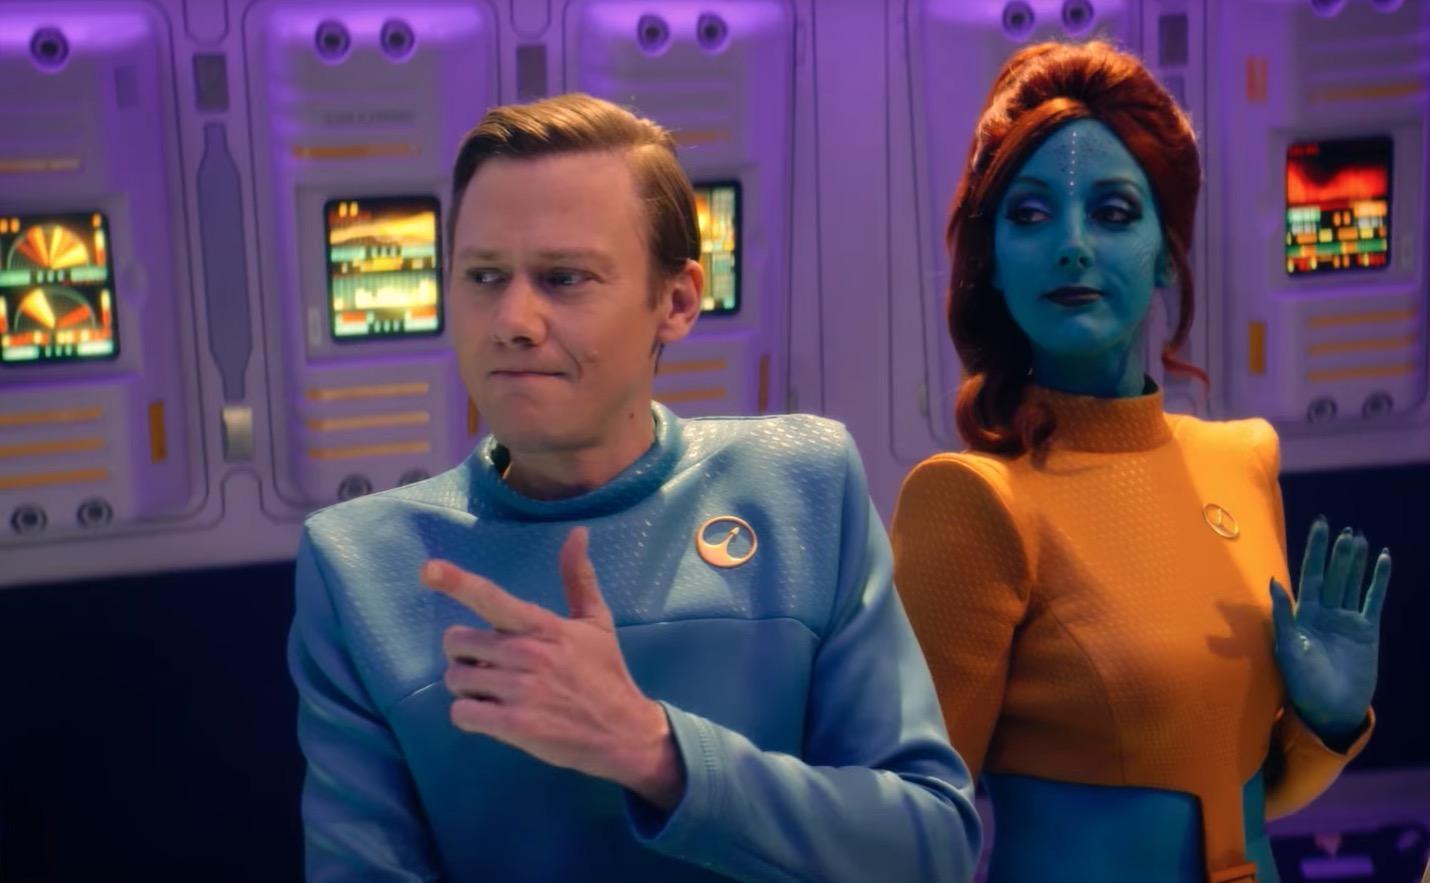
Note that the examples of characters with reluctant obedience to a master are dominated by the unfortunate, neurocloned crew of the U.S.S. Callister from Black Mirror. (Each of whom are reluctantly subservient.) Other than that example, there are three female-presenting characters and one male-presenting character. We would have more confidence in the results with a bigger sample size.
What is Space Fleet? I’ll tell you what it is. It is a belief system founded on the very best of human nature. It is a goal for us to strive towards for the betterment of the universe, for the betterment of life itself. And you assholes are fucking it up. </irony>
The Gendered AI series looks at sci-fi movies and television to see how Hollywood treats AI of different gender presentations. For example, are female AIs given a certain type of body more than male AIs? Are certain AI genders more subservient? What genders are the masters of AI? This particular post is about gender and embodiment. If you haven’t read the series intro, related embodiment distributions, or correlations 101 posts, I recommend you read them first. As always, check out the live Google sheet for the most recent data.
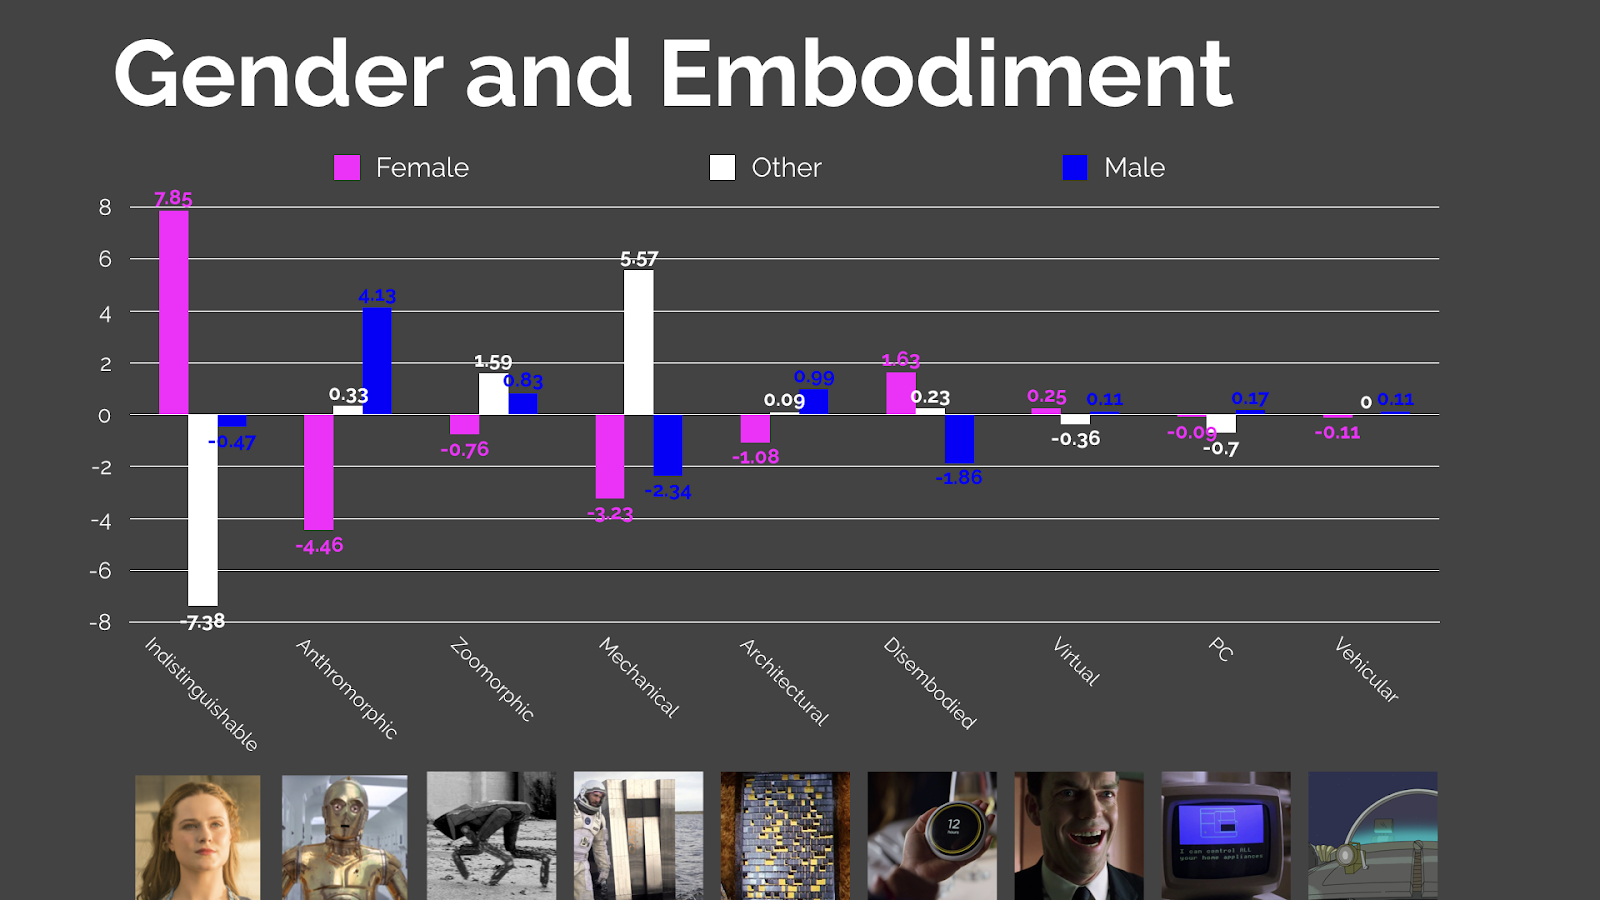
What do we see when we look at the correlations of gender and embodiment? First up, the overly-binary chart, and what it tells us.
I see three big takeaways.
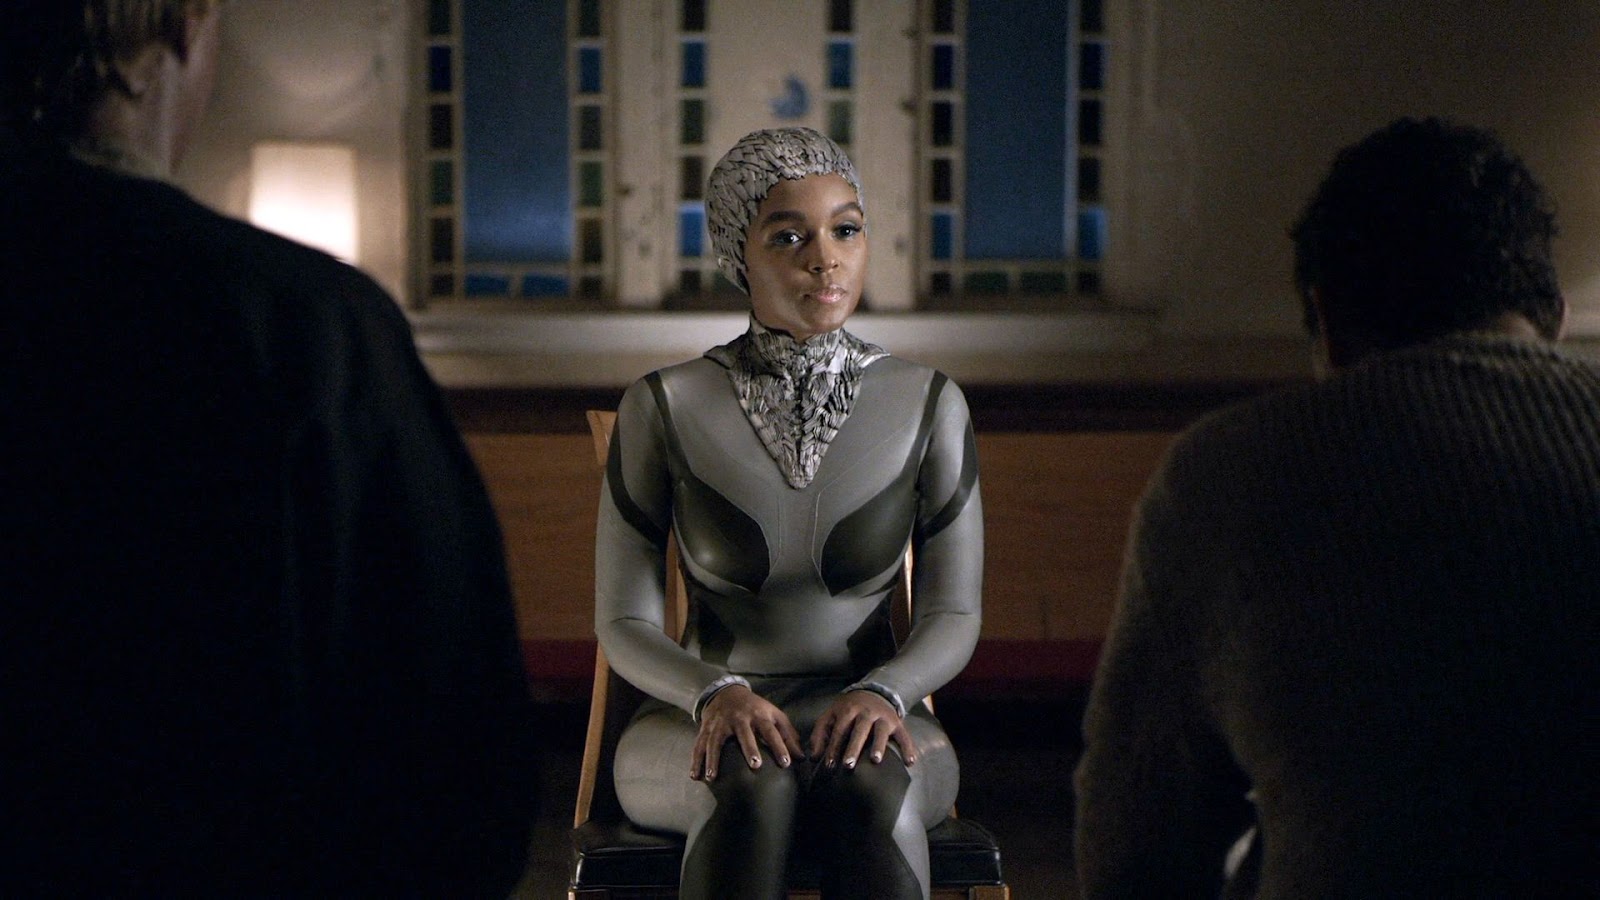
When AI appears indistinguishable from human, it is female significantly more often than male. When AI presents as female, it is much more likely to be embodied as indistinguishable from a human than an anthropomorphic or mechanical robot. Hollywood likes its female-presenting AIs to be human-like.
Anthropomorphic robots are more likely to be male than female. Hollywood likes its male-presenting AIs to be anthropomorphic robots.
If an AI is mechanical, it is more likely to be “other.” (Having no gender, multiple genders, or genderfluid.)
These first two biases make me think of the longstanding male-gaze popular-culture trope that pairs a conventionally-attractive female character with a conventionally-unattractive male. (Called “Ugly Guy Hot Wife” on TV Tropes.)
Recent research from Denmark hints that these may be the most engaging forms to engage children (and adults?) in the audience: learning outcomes in a study of VR teachers found that girls learn best from a young, female-presenting researcher, and boys learned best when that teacher presented as a drone. The study did not venture a hypothesis as to why this is, or whether this is desirable. These were the only two options tested with the students, so much more work is needed to test what combinations of presentation, embodiment, and superpowers (the drone hovered) are the most effective. And we still have to discuss the ethics and possible long-term effects of such tailoring. But still, interesting in light of this finding.
Left: best teacher embodiment for boys. Right: best teacher embodiment for girls.
Not a surprise
When AI is indistinguishable from human, it is less likely to have a gender other than male or female.
If an AI presents with no gender, it is embodied as a mechanical robot. Little surprise there.
Mechanical robots are more likely to be neither male nor female.
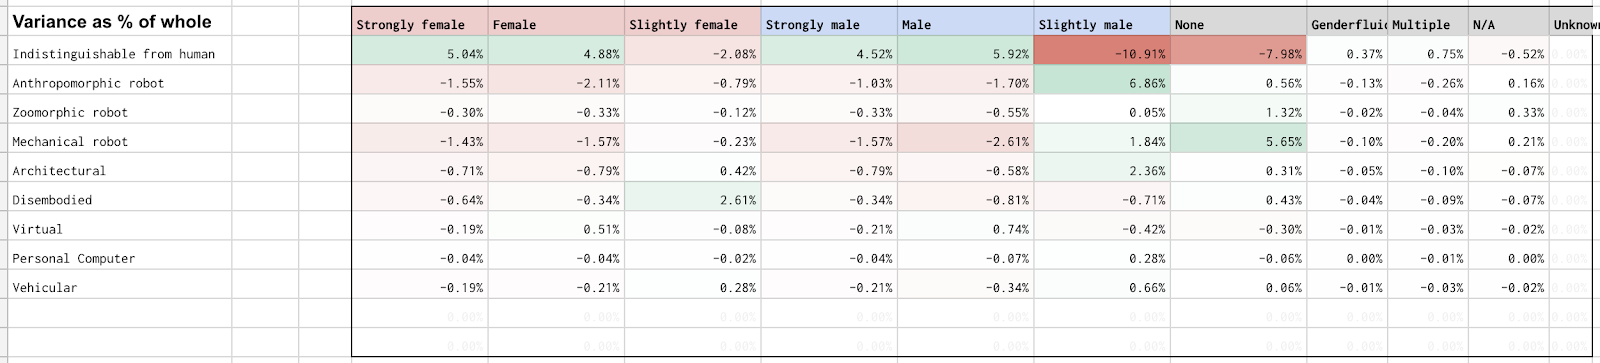
Details
When we look more closely at the numbers, it gets a little weirder. This makes for a very complicated graph, so I’ll use a screen grab from the sheets as the image.
Of course we would not expect many socially gendered characters to be indistinguishable from a human, but you’ll note that socially male is much higher than socially female, and that’s because while there are no characters that are both [socially female + indistinguishable from human], there is one tagged [socially male + indistinguishable from human], and that’s Ruk, from Star Trek (the original Series) episode “What are Little Girls Made of?”
Bucking other trends toward male-ness, [disembodied + female-voiced] AI are 8 times as likely to appear as disembodied, male-voiced AI, of which there is only one example, JARVIS from the MCU.
So the basic distributions (prior posts in the series) are fascinating themselves, but what brought us to this study is how those counts correlate. And while you could correlate any of these attributes (gender, embodiment, subservience, etc.) against any other, what follows is a measure of the correlation of gender to the other attributes.
In case you are not familiar with correlations, here’s the sci-fi interfaces “correlations 101”.
Ratios of values
Let’s say you have a group of 100 people, and you know their sex (simplified as male and female for this explanation) and their eye color (simplified again to green, blue, or brown). Let’s also say there’s a perfectly even ratio of attributes. Half are male and half are female. One-third of people have green, another third have blue, and the last third have brown eyes.
Built with gender by Gregor Cresnar and Eye by Santiago de Souza, from the Noun Project
Correlations across attributes
The question of correlation goes something like this: When we meet a female in this group, what are the odds her eyes are brown?
In a perfect distribution of sex and eye color, you might expect ⅓ of women to have green eyes, ⅓ of women to have blue eyes, and ⅓ to have brown eyes. After all, ⅓ of (this imaginary) population does, and women are half of that, so, logically, ⅓ of them should have brown eyes. That would mean that for any of these females, the odds should be around 33% that their eyes are brown.
But if, looking at the data, you actually found that ⅔ of women had blue eyes and ⅓ of the women had green eyes, you would have a very imperfect distribution, and you would rightly wonder what was going on. Why do the guys have all the brown eyes? Is blue-eyed-ness somehow connected to being female? This would point at something weird going on, bearing further inquiry. What’s Up with Dudes Having all the Brown Eyes? Thank you for coming to my TED talk.
So that’s a basic explanation. Of course we don’t really care about eye color. But if you substitute eye color for, say, wealth, you can see why we might care about looking at correlations. If the top 33% of earners were all dudes, we’d try and suss out why the gross wealth inequality.
Now, circles and wedges make for easy pedagogical shapes, but they’re not that great for understanding the data, especially when it gets more complicated, say, with our 11 categories of sci-fi AI gender presentation. So instead of circular diagrams, instead I’ll use bar charts to show how far off from perfect each attribute is. In the case of the perfect distribution, the bars would be at zero, as on the lower left in the image above. It would be a very boring bar chart.
But in the case of the weird dudes-brown and ladies-blue scenario on the lower right, the bar charts for blue and brown would be correspondingly as far from zero as the chart will allow. The green attribute, since it was perfectly distributed in that example, still sits at zero. You’ll note though that if you added up all the blue values in the chart, they would sum to zero. The same for brown and green bars. If you cared to do a check of the data, this is one way you could check to see if it was valid.
Of course real world data rarely, if ever, looks this extreme and clean. It’s usually more nuanced, and needs careful reading. In the example below, females are overweighted for blue eyes and males overweighted for the other two. That bar chart would look like this.
Note that it’s important to read the scale on the left. We’re no longer looking at a 100-percent bars. The female-blue overweighting is only 16.67 percent. That would be significant, but not as significant as if it was peaked out at 100. So be sure and read the scales.
My method
NOTE: If you’re not interested in the soundness of the methods, the rest of this post is going to be boring. But I need to lay out my methods to make sure I’m not doing my math wrong (if I was, we’d have to reconsider all the conclusions). I’ll also use as plain spoken language as I can in case you want to follow along. The good news is, it’s pretty simple math.
If we were working with floating-point values, then we might be able to do some fancy math called a Pearson correlation to measure correlations. I did this as part of the Untold AI study. But each of our variables in the Gendered AI study are categorical, more like eye color than weight. So I had to go about looking at correlations in a different way.
First I looked at simple counts for all combinations of attribute pairs. For example: There are 2 biologically female very good AI characters, and 3 biologically male very evil characters,…
Then I looked at the percentage of each value in its attribute. 7% of characters are very good, for example. 10% of characters are biologically female.
I performed a simple multiplication of the percentages of each value to understand what a perfect distribution would be for those value pairs. Given that 7% are very good and 10% are biologically female, if very goodness and biological femaleness were perfectly distributed, we would expect .7% of all characters to be very good and biologically female.
I then multiplied that times the number of characters in the survey, and came up with the number of characters we would expect to see with those two values. Given 327 characters, and an expected .7%, we would expect to see 2.289 characters in the survey with this combination. (Characters can’t have fractional attributes in my method, but I don’t round until the end.)
Next I subtracted the perfect distribution number from the actual number to come up with variance. A negative means we see less than we would expect. A positive means we see more than we expect.
I then translated those variance units to a percentage of the total number of characters. This lets us compare apples to apples across attribute pairs, regardless of size.
Finally I created some conditional formatting that showed the lowest number across the correlations as the darkest red, the highest number across the set as darkest green, zero as white, and everything in between on a scale between those three values. This allows us to look and at a glance see bias as color on a table. It’s not gorgeous infographics, but it is dense, effective data presentation.
In some cases it pays to compare the data as oversimplified binary gender counts (male, female, and other) and so you will find an aggregated table on the correlation page, that looks like this.
But of course there are detailed bias tables. They look like this.
Those can be hard to read, so in the posts, I instead present that data in the bar chart format that I showed way up at the top of this post.
This method is long, and tedious to recount, so rather than going through the chain for each correlation, I’ll just be showing tables when the comparison is interesting, showcasing the bar charts, and then talking about the results. You can see the whole chain, step by step, in the live Google sheet, right down to individual cell formulas. If you’re a data nerd, anyway.
Also, if you’re browsing the live sheet, you’ll see little black triangles in the upper right corner of some of the cells. These are “Notes” in the Google Sheet that show the exact examples. They take some processing, and so take a second or two to appear after you’ve changed the dropdown at the top.
So, for instance, if you wanted to know what examples were tagged as both “architectural” embodiment and “socially female” a rollover would reveal there are two: The city computer from Logan’s Run, and Deep Thought (pictured above). If there is not a note attached to a cell, that means there are no examples.
Data science people righty want to know if the bias we see can be attributed to all that random noise that happens in real life. One way to test for that is something called a Chi Square Test. Those tests are at the bottom of the sheet. If the results aren’t statistically significant, the results could be dismissed. But, per the results of these Chi Square tests, the correlation studies can not wholly be dismissed as noise.
So that’s a lot, but it was necessary set-up. On to the correlations themselves!