So while the world is in the grip of the novel COVID-19 coronavirus pandemic, I’ve been thinking about those fictional user interfaces that appear in pandemic movies that project how quickly the infectious-agent-in-question will spread. The COVID-19 pandemic is a very serious situation. Most smart people are sheltering in place to prevent an overwhelmed health care system and finding themselves with some newly idle cycles (or if you’re a parent like me, a lot fewer idle cycles). Looking at this topic through the lens of sci-fi is not to minimize what’s happening around us as trivial, but to process the craziness of it all through this channel that I’ve got on hand. I did it for fascism, I’ll do it for this. Maybe this can inform some smart speculative design.
 Caveat #1: As a public service I have included some information about COVID-19 in the body of the post with a link to sources. These are called out the way this paragraph is, with a SARS-CoV-2 illustration floated on the left. I have done as much due diligence as one blogger can do to not spread disinformation, but keep in mind that our understanding of this disease and the context are changing rapidly. By the time you read this, facts may have changed. Follow links to sources to get the latest information. Do not rely solely on this post as a source. If you are reading this from the relative comfort of the future after COVID-19, feel free to skip these.

And yes, this is less of my normal fare of sci-fi and more bio-fi, but it’s still clearly a fictional user interface, so between that and the world going pear-shaped, it fits well enough. I’ll get back to Blade Runner soon enough. I hope.
Giving credit where it’s due: All but one of the examples in this post were found via the TV tropes page for Spreading Disaster Map Graphic page, under live-action film examples. I’m sure I’ve missed some. If you know of others, please mention it in the comments.
Four that are extradiegetic and illustrative
This first set of pandemic maps are extradiegetic.
Vocabulary sidebar: I use that term a lot on this blog, but if you’re new here or new to literary criticism, it bears explanation. Diegesis is used to mean “the world of the story,” as the world in which the story takes place is often distinct from our own. We distinguish things as diegetic and extradiegetic to describe when they occur within the world of the story, or outside of it, respectively. My favorite example is when we see a character in a movie walking down a hallway looking for a killer, and we hear screechy violins that raise the tension. When we hear those violins, we don’t imagine that there is someone in the house who happens to be practicing their creepy violin. We understand that this is extradiegetic music, something put there to give us a clue about how the scene is meant to feel.
So, like those violins, these first examples aren’t something that someone in the story is looking at. (Claude Paré? Who the eff is—Johnson! Get engineering! Why are random names popping up over my pandemic map?) They’re something the film is doing for us in the audience.
There’s not much I feel the need to say about these kinds of maps, as they are a motion graphic and animation style. I note at least two use aposematic signals in their color palette and shapes, but that’s just because it helps reinforce for the audience that whatever is being shown here is a major threat to human life. But I have much more authoritative things to say about systems that are meant to be used.
Before we move on, here’s a bonus set of extradiegetic spreading-pathogen maps I saw while watching the Netflix docuseries Pandemic: How to Prevent an Outbreak, as background info for this post.
Motion graphics by Zero Point Zero Productions.
Five that are diegetic and informative
The five examples in this section are spread throughout the text for visual interest, but presented in chronological order. They are The Andromeda Strain (1977), Outbreak (1995), Evolution (2001), Contagion (2011), and World War Z (2013). I highly recommend Contagion for the acting, movie making, the modeling, and some of the facts it conveys. For instance, I think it’s the only film that discusses fomites. Everyone should know about fomites.
Since I raise their specter: As of publication of this post the CDC stated that fomites are not thought to be the main way the COVID-19 novel coronavirus spreads, but there are recent and conflicting studies. The scientific community is still trying to figure this out. The CDC says for certain it spreads primarily through sneezes, coughs, and being in close proximity to an infected person, whether or not they are showing symptoms.
Note that these five spreading pathogen examples are things that characters are seeing in the diegesis, that is, in the context of the story. These interfaces are meant to convey useful information to the characters as well as us in the audience.
Which is as damning a setup as I can imagine for this first example from The Andromeda Strain (1971). Because as much as I like this movie, WTF is this supposed to be? “601” is explained in the dialogue as the “overflow error” of this computer, but the pop-art seizure graphics? C’mon. There’s no way to apologize for this monstrosity.
I’m sorry that you’ll never get those 24 seconds back. But at least we can now move on to look at the others, which we can break down into the simple case of persuasion, and the more complex case of use.
The simple case
In the simplest case, these graphics are shown to persuade an authority to act. That’s what happening in this clip from Outbreak (1995).
But if the goal is to persuade one course of action over another, some comparison should be made between two options, like, say, what happens if action is taken sooner rather than later. While that is handled in the dialogue of many of these films—and it may be more effective for in-person persuasion—I can’t help but think it would be reinforcing to have it as part of the image itself. Yet none of our examples do this.
Compare the “flatten the curve” graphics that have been going around. They provide a visual comparison between two options and make it very plain which is the right one to pick. One that stays in the mind of the observer even after they see it. This is one I’ve synthesized and tweaked from other sources.

There is a diegetic possibility, i.e., that no one amidst the panic of the epidemic has the time to thoughtfully do more than spit out the data and handle the rest with conversation. But we shouldn’t leave it at that, because there’s not much for us to learn there.
More complex case
The harder problem is when these displays are for people who need to understand the nature of the threat and determine the best course of action, and now we need to talk about epidemiology.
Caveat #2: I am not an epidemiologist. They are all really occupied for the foreseeable future, so I’m not even going to reach out and bother one of them to ask their opinions on this post. Like I said before about COVID-19, I really hope you don’t come to sci-fi interfaces to become an expert in epidemiology. And, since I’m just Some Guy on the Internet Who Has Read Some Stuff on the Internet, you should take whatever you learn here with a grain of salt. If I get something wrong, please let me know. Here are my major sources:
- The Center for Disease Control’s free-to-download self-study coursework, “Principles of Epidemiology in Public Health Practice, Third Edition.”
- The CDC website on COVID-19
- The World Health Organization’s free chapter, “Basics of Epidemiology.”

Caveat #3: To discuss using technology in our species’ pursuit of an effective global immune system is to tread into some uncomfortable territory. Because of the way disease works, it is not enough to surveil the infected. We must always surveil the entire population, healthy or not, for signs of a pathogen outbreak, so responses can be as swift and certain as possible. We may need to surveil certain at-risk or risk-taking populations quite closely, as potential superspreaders. Otherwise we risk getting…well…*gestures vaguely at the USA*. I am pro-privacy, so know that when I speak about health surveillance in this post, I presume that we are simultaneously trying to protect as much “other” privacy as we can, maybe by tracking less-abusable, less-personally identifiable signals. I don’t pretend this is a trivial task, and I suspect the problem is more wicked than merely difficult to execute. But health surveillance must happen, and for this reason I will speak of it as a good thing in this context.

Caveats complete? We’ll see.
Epidemiology is a large field of study, so for purposes of this post, we’re talking about someone who studies disease at the level of the population, rather than individual cases. Fictional epidemiologists appear when there is an epidemic or pandemic in the plot, and so are concerned with two questions: What are we dealing with? and What do we need to do?
Part 1: What are we dealing with?
Our response should change for different types of threat. So it’s important for an epidemiologist to understand the nature of a pathogen. There are a few scenes in Contagion where we see scientists studying a screen with gene sequences and a protein-folding diagram, and this touches on understanding the nature of the virus. But this is a virologists view, and doesn’t touch on most of what an epidemiologist is ultimately hoping to build first, and that’s a case definition. It is unlikely to appear in a spreading pathogen map, but it should inform one. So even if your pathogen is fictional, you ought to understand what one is.

A case definition is the standard shared definition of what a pathogen is; how a real, live human case is classified as belonging to an epidemic or not. Some case definitions are built for non-emergency cases, like for influenza. The flu is practically a companion to humanity, i.e., with us all the time, and mutates, so its base definition for health surveillance can be a little vague. But for the epidemics and pandemics that are in sci-fi, they are building a case definition for outbreak investigations. These are for a pathogen in a particular time and place, and act as a standard for determining whether or not a given person is counted as a case for the purposes of studying the event.
Case definition for outbreak investigations
The CDC lists the following as the components of a case definition.
- Clinical criteria
- Clinical description
- Confirmatory laboratory tests
- These can be pages long, with descriptions of recommended specimen collections, transportation protocols, and reporting details.
- Combinations of symptoms (subjective complaints)
- Signs (objective physical findings)
- Source
- (Sometimes) Specifics of time and place.
There are sometimes different case definitions based on the combination of factors. COVID-19 case definitions with the World Health Organization, for instance, are broken down between suspect, probable, and confirmed. A person showing all the symptoms and who has been in an area where an infected person was would be suspect. A person whose laboratory results confirmed the presence of SARS-CoV-2 is confirmed. Notably for a map, these three levels might warrant three levels of color.
As an example, here is the CDC case definition for ebola, as of 09 JUL 2019.

n.b. Case definitions are unlikely to work on screen
Though the case definition is critical to epidemiology, and may help the designer create the spreading pathogen map (see the note about three levels of color, above), but the thing itself is too text-heavy to be of much use for a sci-fi interface, which rely much more on visuals. Better might be the name or an identifying UUID to the definition. WHO case references look like this: WHO/COVID-19/laboratory/2020.5 I do not believe the CDC has any kind of UUID for its case definitions.
While case definitions don’t work on screen, counts and rates do. See below under Surveil Public Health for more on counts and rates.
Disease timeline
Infectious disease follows a fairly standard order of events, depicted in the graphic below. Understanding this typical timeline of events helps you understand four key metrics for a given pathogen: chains of transmission, R0, SI, and CFR.

For each of the key metrics, I’ll list ranges and variabilities where appropriate. These are observed attributes in the real world, but an author creating a fictional pathogen, or a sci-fi interfaces maker needing to illustrate them, may need to know what those numbers look like and how they tend to behave over time so they can craft these attributes.
Chains of Transmission
What connects the individual cases in an epidemic are the methods of transmission. The CDC lists the following as the basics of transmission.
- Reservoir: where the pathogen is collected. This could be the human body, or a colony of infected mynocks, a zombie, or a moldy Ameglian Major flank steak forgotten in a fridge. Or your lungs.
- Portal of exit, or how the pathogen leaves the reservoir. Say, the open wound of a zombie, or an innocent recommendation, or an uncovered cough.
- Mode of transmission tells how the pathogen gets from the portal of exit to the portal of entry. Real-world examples include mosquitos, fomites (you remember fomites from the beginning of this post, don’t you?), sex, or respiratory particles.
- Portal of entry, how the pathogen infects a new host. Did you inhale that invisible cough droplet? Did you touch that light saber and then touch your gills? Now it’s in you like midichlorians.
- Susceptible host is someone more likely than not to get the disease.
A map of this chain of transmission would be a fine secondary-screen to a spreading pathogen map, illustrating how the pathogen is transmitted. After all, this will inform the containment strategies.
Variability: Once the chain of transmission is known, it would only change if the pathogen mutated.
Basic Rate of Reproduction = How contagious it is
A famous number that’s associated with contagiousness is the basic reproduction rate. If you saw Contagion you’ll recall this is written as R0, and pronounced “R-naught.” It describes, on average, how many people an infected person will infect before they stop being infectious.
- If R0 is below 1, an infected person is unlikely to infect another person, and the pathogen will quickly die out.
- If R0 is 1, an infected person is likely to infect one other, and the disease will continue through a population at a steady rate without intervention.
- If R0 is higher than 1, a pathogen stands to explode through a population.
The CDC book tells me that R0 describes how the pathogen would reproduce through the population with no intervention, but other sources talk of lowering the R0 so I’m not certain if those other sources are using it less formally, or if my understanding is wrong. For now I’ll go with the CDC, and talk about R0 as a thing that is fixed.
It, too, is not an easy thing to calculate. It can depend on the duration of contagiousness after a person becomes infected, or the likelihood of infection for each contact between a susceptible person and an infectious person or vector, and the contact rate.
Variability: It can change over time. When a novel pathogen first emerges, the data is too sparse and epidemiologists are scrambling to do the field work to confirm cases. As more data comes in and numbers get larger, the number will converge toward what will be its final number.
It can also differ based on geography, culture, geopolitical boundaries, and the season, but the literature (such as I’ve read) refers to R0 as a single number.
Range: The range of R0 >1 can be as high as 12–18, but measles morbillivirus is an infectious outlier. Average range of R0, not including measles, of this sample is 2.5–5.2. MEV-1 from Contagion has a major dramatic moment when it mutates and its predicted R0 becomes 4, making it roughly as contagious as the now-eradicated killer smallpox.

Serial Interval = How fast it spreads
Serial interval is the average time between successive cases in a chain of transmission. This tells the epidemiologist how fast a pathogen stands to spread through a population.
Variability: Like the other numbers, SI is calculated and updated with new cases while an epidemic is underway, but tend to converge toward a number. SI for some respiratory diseases is charted below. Influenza A moves very fast. Pertussis is much slower.
Range: As you can see in the chart, SI can be as fast as 2.2 days, or as slow as 22.8 days. The median in this set is 14 days and the average is 12.8. SARS-CoV-2 is currently estimated to be about 4 days, which is very fast.

CFR = How deadly it is
The case fatality rate is a percentage that any given case will prove fatal. It is very often shortened to CFR. This is not always easy to calculate.
Variability: Early in a pandemic it might be quite low because hospital treatment is still available. Later in a pandemic, as hospital and emergency rooms are packed full, the CFR might raise quite high. Until a pathogen is eradicated, the precise CFR is changing with each new case. Updates can occur daily, or in real time with reports. In a sci-fi world, it could update real time directly from ubiquitous sensors, and perhaps predicted by a specialty A.I. or precognitive character.
Range: Case fatality rates range from the incurable, like kuru, at 100%. to 0.001% for chickenpox affecting unvaccinated children. The CFR changes greatly at the start of a pandemic and slowly converges towards its final number.

So, if the spreading pathogen map is meant to convey to an epidemiologist the nature of the pathogen, it should display these four factors:
- Mode of Transmission: How it spreads
- R0: How contagious it is
- SI: How fast it spreads
- CFR: How deadly it is
Part 2: What do we do?
An epidemiologist during an outbreak has a number of important responsibilities beyond understanding the nature of the pathogen. I’ve taken a crack at listing those below. Note: this list is my interpretation of the CDC materials, rather than their list. As always, offer corrections in comments.
- Surveil the current state of things
- Prevent further infections
- Communicate recommendations
Epidemiology has other non-outbreak functions, but those routine, non-emergency responsibilities rarely make it to cinema. And since “communicate recommendations” is pretty covered under “The Simple Case,” above, the rest of this post will be dedicated to health surveillance and prevention tools.
Surveil the current state of things
In movies the current state of things is often communicated via the spreading pathogen map in some command and control center. The key information on these maps are counts and rates.
Counts and Rates
The case definition (above) helps field epidemiologists know which cases to consider in the data set for a given outbreak. They routinely submit reports of their cases to central authorities like the CDC or WHO, who aggregate them into counts, which are tallies of known cases. (And though official sources in the real world are rightly cautious to do it, sci-fi could also include an additional layer of suspected or projected cases.) Counts, especially over time, are important for tracking the spread of a virus. Most movie goers have basic numeracy, so red number going up = bad is an easy read for an audience.
Counts can be broken down into many variables. Geopolitical regions make sense as governmental policies and cultural beliefs can make meaningful distinctions in how a pathogen spreads. In sci-fi a speculative pathogen might warrant different breakdowns, like frequency of teleportation, or time spent in FTL warp fields, or genetic distance from the all-mother.
In the screen cap of the John Hopkins COVID-19 tracker, you can see counts high in the visual hierarchy for total confirmed (in red), total deaths (in white), and total recovered (in green). The map plots current status of the counts.
Rates is another number that epidemiologists are interested in, to help normalize the spread of a pathogen for different group sizes. (Colloquially, rate often implies change over time, but in the field of epidemiology, it is a static per capita measurement of a point in time.) For example, 100 cases is around a 0.00001% rate in China, with its population of 1.386 billion, but it would be a full 10% rate of Vatican City, so count can be a poor comparison to understand how much of a given population is affected. By representing the rates alongside the counts you can detect if it’s affecting a subgroup of the global population more or less than others of its kind, which may warrant investigation into causes, or provide a grim lesson to those who take the threat lightly.
Counts and rates over time
The trend line in the bottom right of the Johns Hopkins dashboard helps understand how the counts of cases are going over time, and might be quite useful for helping telegraph the state of the pandemic to an audience, though having it tucked in a corner and in orange may not draw attention as it needs to for instant-understanding.


These two displays show different data, and one is more cinegenic than the other. Confirmed cases, on the left, is a total, and at best will only ever level off. If you know what you’re looking at, you know that older cases represented by the graph are…uh…resolved (i.e. recovery, disability, or death) and that a level-off is the thing we want to see there. But the chart on the right plots the daily increase, and will look something like a bell curve when the pandemic comes to an end. That is a more immediate read (bad thing was increasing, bad thing peaked, bad thing is on the decline) and so I think is better for cinema.

In the totals, sparklines would additionally help a viewer know whether things are getting better or getting worse in the individual geos, and would help sell the data via small multiples on a close-up.
Plotting cases on maps
Counts and rates are mostly tables of numbers with a few visualizations. The most cinegenic thing you can show are cases on geopolitical maps. All of the examples, except the trainwreck that is The Andromedia Strain pathogen map, show this, even the extradiegetic ones. Real-world pathogens mostly spread through physical means, so physical counts of areas help you understand where the confirmed cases are.
Which projection?
But as we all remember from that one West Wing scene, projections have consequences. When wondering where in the world do we send much-needed resources, Mercator will lie to you, exaggerating land at the poles at the expense of equatorial regions. I am a longtime advocate for alternate projections, such as—from the West Wing scene—the Gall-Peters. I am an even bigger big fan of Dymaxion and Watterman projections. I think they look quite sci-fi because they are familiar-but-unfamiliar, and they have some advantages for showing things like abstract routes across the globe.

If any supergenre is here to help model the way things ought to be, it’s sci-fi. If you only have a second or less of time to show the map, then you may be locked to Mercator for its instant-recognizability, but if the camera lingers, or you have dialogue to address the unfamiliarity, or if the art direction is looking for uncanny-ness, I’d try for one of the others.
What is represented?
Of course you’re going to want to represent the cases on the map. That’s the core of it. And it may be enough if the simple takeaway is thing bad getting worse. But if the purpose of the map is to answer the question “what do we do,” the cases may not be enough. Recall that another primary goal of epidemiologists is to prevent further infections. And the map can help indicate this and inform strategy.
Take for instance, 06 APR 2020 of the COVID-19 epidemic in the United States. If you had just looked at a static map of cases, blue states had higher counts than red states. But blue states had been much more aggressive in adopting “flattening the curve” tactics, while red states had been listening to Trump and right wing media that had downplayed the risk for many weeks in many ways. (Read the Nate Silver post for more on this.) If you were an epidemiologist, seeing just the cases on that date might have led you to want to focus social persuasion resources on blue states. But those states have taken the science to heart. Red states on the other hand, needed a heavy blitz of media to convince them that it was necessary to adopt social distancing and shelter-in-place directives. With a map showing both cases and social acceptance of the pandemic, it might have helped an epidemiologist make the right resource allocation decision quickly.
Another example is travel routes. International travel played a huge role in spreading COVID-19, and visualizations of transportation routes can prove more informative in understanding its spread than geographic maps. Below is a screenshot of the New York Times’ beautiful COVID-19 MAR 2020 visualization How the Virus Got Out, which illustrates this point.


Other things that might be visualized depend, again, on the chain of transmission.
- Is the pathogen airborne? Then you might need to show upcoming wind and weather forecasts.
- Is the reservoir mosquitoes? Then you might want to show distance to bodies of still water.
- Is the pathogen spread through the mycelial network? Then you might need to show an overlay of the cosmic mushroom threads.
Whatever your pathogen, use the map to show the epidemiologist ways to think about its future spread, and decide what to do. Give access to multiple views if needed.
How do you represent it?
When showing intensity-by-area, there are lots of ways you could show it. All of them have trade offs. The Johns-Hopkins dashboard uses a Proportional Symbol map, with a red dot, centered on the country or state, the radius of which is larger for more confirmed cases. I don’t like this for pandemics, mostly because the red dots begin to overlap and make it difficult to any detail without interacting with the map to get a better focus. It does make for an immediate read. In this 23 MAR 2020 screen cap, it’s pretty obvious that the US, Europe, and China are current hotspots, but to get more detail you have to zoom in, and the audience, if not the characters, don’t have that option. I suppose it also provides a tone-painting sense of unease when the symbols become larger than the area they are meant to represent. It looks and feels like the area is overwhelmed with the pathogen, which is an appropriate, if emotional and uninformative, read.

Most of the sci-fi maps we see are a variety of Chorochromatic map, where color is applied to the discrete thing where it appears on the map. (This is as opposed to a Cloropleth map, where color fills in existing geopolitical regions.) The chorochromatic option is nice for sci-fi because the color makes a shape—a thing—that does not know of or respect geopolitical boundaries. See the example from Evolution below.
It can be hard to know (or pointlessly-detailed) to show exactly where a given thing is on a map, like, say, where infected people literally are. To overcome this you could use a dot-distribution map, as in the Outbreak example (repeated below so you don’t have to scroll that far back up).
Like many such maps, the dot-distribution becomes solid red to emphasize passing over some magnitude threshold. For my money, the dots are a little deceptive, as if each dot represented a person rather than part of a pattern than indicates magnitude, but a glance at the whole map gives the right impression.
For a real world example of dot-distribution for COVID-19, see this example posted to reddit.com by user Edward-EFHIII.
Often times dot-distribution is reserved for low magnitudes, and once infections are over a threshold, become cloropleth maps. See this example from the world of gaming.
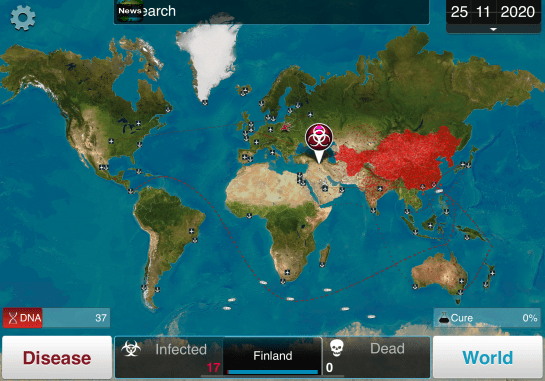
Here you can see that India and Australia have dots, while China, Kyrgyzstan, Tajikistan, Turkmenistan, and Afghanistan (I think) are “solid” red.
The other representation that might make sense is a cartogram, in which predefined areas (like country or state boundaries) are scaled to show the magnitude of a variable. Continuous-area cartograms can look hallucinogenic, and would need some explanation by dialogue, but can overcome the inherent bias that size = importance. It might be a nice secondary screen alongside a more traditional one.

Another gorgeous projection dispenses with the geographic layout. Dirk Brockman, professor at the Institute for Theoretical Biology, Humboldt University, Berlin, developed a visualization that places the epicenter of a disease at the center of a node graph, and plots every city around it based on how many airport flights it takes to get there. Plotting proportional symbols to this graph makes the spread of the disease radiate in mostly- predictable waves. Pause the animation below and look at the red circles. You can easily predict where the next ones will likely be. That’s an incredibly useful display for the epidemiologist. And as a bonus, it’s gorgeous and a bit mysterious, so would make a fine addition in a sci-fi display to a more traditional map. Read more about this innovative display on the CityLab blog. (And thanks, Mark Coleran, for the pointer.)
How does it move?
First I should say I don’t know that it needs to move. We have information graphics that display predicted change-over-area without motion: Hurricane forecast maps. These describe a thing’s location in time, and simultaneously, the places it is likely to be in the next few days.

Image: NHC
If you are showing a chorochromatic map, then you can use “contour lines” or color regions to demonstrate the future predictions.

Another possibility is small multiples, where the data is spread out over space instead of time. This makes it harder to compare stages, but doesn’t have the user searching for the view they want. You can mitigate this with small lines on each view representing the boundaries of other stages.

The side views could also represent scenarios. Instead of +1, +2, etc., the side views could show the modeled results for different choices. Perhaps those scenario side views and their projected counts could be animated.
To sing the praises of the static map: Such a view, updated as data comes in, means a user does not have to wait for the right frame to pop up, or interact with a control to get the right piece of information, or miss some detail when they just happened to have the display paused on the wrong frame of an animation.
But, I realize that static maps are not as cinegenic as a moving map. Movement is critical to cinema, so a static map, updating only occasionally as new data comes in, could look pretty lifeless. Animation gives the audience more to feel as some red shape slowly spreads to encompass the whole world. So, sure. I think there are better things to animate than the primary map, but doing so puts us back into questions of style rather than usability, so I’ll leave off that chain of thought and instead show you the fourth example in this section, Contagion.


Prevent further transmissions: Containment strategies
The main tactic for epidemiological intervention is to deny pathogens the opportunity to jump to new hosts. The top-down way to do this is to persuade community leaders to issue broad instructions, like the ones around the world that have us keeping our distance from strangers, wearing masks and gloves, and sheltering-in-place. The bottom-up tactic is to identify those who have been infected or put at risk for contracting a pathogen from an infected person. This is done with contact tracing.
Contain Known Cases
When susceptible hosts simply do not know whether or not they are infected, some people will take their lack of symptoms to mean they are not infectious and do risky things. If these people are infectious but not yet showing symptoms, they spread the disease. For this reason, it’s critical to do contact tracing of known cases to inform and encourage people to get tested and adopt containment behaviors.
Contact tracing
There are lots of scenes in pathogen movies where scientists stand around whiteboards with hastily-written diagrams of who-came-into-contact-with-whom, as they hope to find and isolate cases, or to find “patient 0,” or to identify super-spreaders and isolate them.

These scenes seem ripe for improvement by technology and AI. There are opt-in self-reporting systems, like those that were used to contain COVID-19 in South Korea, or the proposed NextTrace system in the West. In sci-fi, this can go further.
Scenario: Imagine an epidemiologist talking to the WHO AI and asking it to review public footage, social media platforms, and cell phone records to identify all the people that a given case has been in contact with. It could even reach out and do field work, calling humans (think Google Duplex) who might be able to fill in its information gaps. Field epidemiologists are focused on situations when the suspected cases don’t have phones or computers.
Or, for that matter, we should ask why the machine should wait to be asked. It should be set up as an agent, reviewing these data feeds continually, and reaching out in real time to manage an outbreak.
- SCENE: Karen is walking down the sidewalk when her phone rings.
- Computer voice:
- Good afternoon, Karen. This is Florence, the AI working on behalf of the World Health Organization.
- Karen:
- Oh no. Am I sick?
- Computer voice:
- Public records indicate you were on a bus near a person who was just confirmed to be infected. Your phone tells me your heart rate has been elevated today. Can you hold the phone up to your face so I can check for a fever?
- Karen does. As the phone does its scan, people on the sidewalk behind her can be seen to read texts on their phone and move to the other side of the street. Karen sees that Florence is done, and puts the phone back to her ear.
- Computer voice:
- It looks as if you do have a fever. You should begin social distancing immediately, and improvise a mask. But we still need a formal test to be sure. Can you make it to the testing center on your own, or may I summon an ambulance? It is a ten minute walk away.
- Karen:
- I think I can make it, but I’ll need directions.
- Computer voice:
- Of course. I have also contacted your employer and spun up an AI which will be at work in your stead while you self-isolate. Thank you for taking care of yourself, Karen. We can beat this together.
Design challenge: In the case of an agentive contact tracer, the display would be a social graph displayed over time, showing confirmed cases as they connect to suspected cases (using evidence-of-proximity or evidence-of-transmission) as well as the ongoing agent’s work in contacting them and arranging testing. It would show isolation monitoring and predicted risks to break isolation. It would prioritize cases that are greatest risk for spreading the pathogen, and reach out for human intervention when its contact attempts failed or met resistance. It could be simultaneously tracing contacts “forward” to minimize new infections and tracing contacts backward to find a pathogen’s origins.
Another consideration for such a display is extension beyond the human network. Most pathogens mutate and much more freely in livestock and wild animal populations, making their way into humans occasionally. it happened this way for SARS (bats → civets → people), MERS (bats → camels → people), and COVID-19 (bats → pangolin → people). (Read more about bats as a reservoir.) It’s not always bats, by the way, livestock are also notorious breeding grounds for novel pathogens. Remember Bird flu? Swine flu? This “zoonotic network” should be a part of any pathogen forensic or surveillance interface.

U.S. Fish and Wildlife Service Headquarters / CC BY (https://creativecommons.org/licenses/by/2.0)
Design idea: Even the notion of what it means to do contact tracing can be rethought in sci-fi. Have you seen the Mythbusters episode “Contamination”? In it Adam Savage has a tube latexed to his face, right near his nose that drips a florescent dye at the same rate a person’s runny nose might drip. Then he attends a staged dinner party where, despite keeping a napkin on hand to dab at the fluid, the dye gets everywhere except the one germophobe. It brilliantly illustrates the notion of fomites and how quickly an individual can spread a pathogen socially.
Now imagine this same sort of tracing, but instead of dye, it is done with computation. A camera watches, say, grocery shelves, and notes who touched what where and records the digital “touch,” or touchprint, along with an ID for the individual and the area of contact. This touchprint could be exposed directly with augmented reality, appearing much like the dye under black light. The digital touch mark would only be removed from the digital record of the object if it is disinfected, or after the standard duration of surface stability expires. (Surface stability is how long a pathogen remains a threat on a given surface). The computer could further watch the object for who touches it next, and build an extended graph of the potential contact-through-fomites.

You could show the AR touchprint to the individual doing the touching, this would help remind them to wear protective gloves if the science calls for it, or to ask them to disinfect the object themselves. A digital touchprint could also be used for workers tasked with disinfecting the surfaces, or by disinfecting drones. Lastly, if an individual is confirmed to have the pathogen, the touchprint graph could immediately identify those who had touched an object at the same spot as the infected person. The system could provide field epidemiologists with an instant list of people to contact (and things to clean), or, if the Florence AI described above was active, the system could reach out to individuals directly. The amount of data in such a system would be massive, and the aforementioned privacy issues would be similarly massive, but in sci-fi you can bypass the technical constraints, and the privacy issues might just be a part of the diegesis.
In case you’re wondering how long that touch mark would last for SARS-CoV-2 (the virus that causes COVID-19), this study from the New England Journal of Medicine says it’s 4 hours for copper, 24 hours for paper and cardboard, and 72 hours on plastic and steel.
Anyway, all of this is to say that the ongoing efforts by the agent to do the easy contact tracing would be an excellent, complicated, cinegenic side-display to a spreading pathogen map.
Destroying non-human reservoirs
Another way to reduce the risk of infection is to seal or destroy reservoirs. Communities encourage residents to search their properties and remove any standing water to remove the breeding grounds for mosquitos, for example. There is the dark possibility that a pathogen is so lethal that a government might want to “nuke it from orbit” and kill even human reservoirs. Outbreak features an extended scene where soldiers seek to secure a neighborhood known to be infected with the fictional Motoba virus, and soldiers threaten to murder a man trying to escape with his family. For this dark reason, in addition to distance-from-reservoir, the location of actual reservoirs may be important to your spreading pathogen map. Maybe also counts of the Hail Mary tools that are available, their readiness, effects, etc.
To close out the topic of What Do We Do? Let me now point you to the excellent and widely-citied Medium article by Tomas Peuyo, “Act Today or People Will Die,” for thoughts on that real-world question.
The…winner(?)
At the time of publication, this is the longest post I’ve written on this blog. Partly that’s because I wanted to post it as a single thing, but also because it’s a deep subject that’s very important to the world, and there are lots and lots of variables to consider when designing one.
Which makes it not surprising that most of the examples in this mini survey are kind of weak, with only one true standout. That standout is the World War Z spreading disaster map, shown below.
It goes by pretty quickly, but you can see more features discussed above in this clip than any of the other exmaples.


It doesn’t have that critical layer of forecasting data, but it got so much more right than its peers, I’m still happy to have it. Thanks to Mark Coleran for pointing me to it.
Let’s not forget that we are talking about fiction, and few people in the audience will be epidemiologists, standing up in the middle of the cinema (remember when we could go to cinemas?) to shout, “What’s with this R0 of 0.5? What is this, the LaCroix of viruses?” But c’mon, surely we can make something other than Andromeda Strain’s Pathogen Kaleidoscope, or Contagion’s Powerpoint wipe. Modern sci-fi interfaces are about spectacle, about overwhelming the users with information they can’t possibly process, and which they feel certain our heroes can—but they can still be grounded in reality.
Lastly, while I’ve enjoyed the escapism of talking about pandemics in fiction, COVID-19 is very much with us and very much a threat. Please take it seriously and adopt every containment behavior you can. Thank you for taking care of yourself. We can beat this together.