Internet 2021

The opening shot of Johnny Mnemonic is a brightly coloured 3D graphical environment. It looks like an abstract cityscape, with buildings arranged in rectangular grid and various 3D icons or avatars flying around. Text identifies this as the Internet of 2021, now cyberspace.

Internet 2021 display

Strictly speaking this shot is not an interface. It is a visualization from the point of view of a calendar wake up reminder, which flies through cyberspace, then down a cable, to appear on a wall mounted screen in Johnny’s hotel suite. However, we will see later on that this is exactly the same graphical representation used by humans. As the very first scene of the film, it is important in establishing what the Internet looks like in this future world. It’s therefore worth discussing the “look” employed here, even though there isn’t any interaction.

Cyberspace is usually equated with 3D graphics and virtual reality in particular. Yet when you look into what is necessary to implement cyberspace, the graphics really aren’t that important.

MUDs and MOOs: ASCII Cyberspace

People have been building cyberspaces since the 1980s in the form of MUDs and MOOs. At first sight these look like old style games such as Adventure or Zork. To explore a MUD/MOO, you log on remotely using a terminal program. Every command and response is pure text, so typing “go north” might result in “You are in a church.” The difference between MUD/MOOs and Zork is that these are dynamic multiuser virtual worlds, not solitary-player games. Other people share the world with you and move through it, adventuring, building, or just chatting. Everyone has an avatar and every place has an appearance, but expressed in text as if you were reading a book.

guest>>@go #1914
Castle entrance
A cold and dark gatehouse, with moss-covered crumbling walls. A passage gives entry to the forbidding depths of Castle Aargh. You hear a strange bubbling sound and an occasional chuckle.

Obvious exits:
path to Castle Aargh (#1871)
enter to Bridge (#1916)

Most impressive of all, these are virtual worlds with built-in editing capabilities. All the “graphics” are plain text, and all the interactions, rules, and behaviours are programmed in a scripting language. The command line interface allows the equivalent of Emacs or VI to run, so the world and everything in it can be modified in real time by the participants. You don’t even have to restart the program. Here a character creates a new location within a MOO, to the “south” of the existing Town Square:

laranzu>>@dig MyNewHome
laranzu>> @describe here as “A large and spacious cave full of computers”
laranzu>> @dig north to Town Square

The simplicity of the text interfaces leads people to think these are simple systems. They’re not. These cyberspaces have many of the legal complexities found in the real world. Can individuals be excluded from particular places? What can be done about abusive speech? How offensive can your public appearance be? Who is allowed to create new buildings, or modify existing ones? Is attacking an avatar a crime? Many 3D virtual reality system builders never progress that far, stopping when the graphics look good and the program rarely crashes. If you’re interested in cyberspace interface design, a long running textual cyberspace such as LambdaMOO or DragonMUD holds a wealth of experience about how to deal with all these messy human issues.

So why all the graphics?

So it turns out MUDs and MOOs are a rich, sprawling, complex cyberspace in text. Why then, in 1995, did we expect cyberspace to require 3D graphics anyway?

The 1980s saw two dimensional graphical user interfaces become well known with the Macintosh, and by the 1990s they were everywhere. The 1990s also saw high end 3D graphics systems becoming more common, the most prominent being from Silicon Graphics. It was clear that as prices came down personal computers would soon have similar capabilities.

At the time of Johnny Mnemonic, the world wide web had brought the Internet into everyday life. If web browsers with 2D GUIs were superior to the command line interfaces of telnet, FTP, and Gopher, surely a 3D cyberspace would be even better? Predictions of a 3D Internet were common in books such as Virtual Reality by Howard Rheingold and magazines such as Wired at the time. VRML, the Virtual Reality Markup/Modeling Language, was created in 1995 with the expectation that it would become the foundation for cyberspace, just as HTML had been the foundation of the world wide web.

Twenty years later, we know this didn’t happen. The solution to the unthinkable complexity of cyberspace was a return to the command line interface in the form of a Google search box.

Abstract or symbolic interfaces such as text command lines may look more intimidating or complicated than graphical systems. But if the graphical interface isn’t powerful enough to meet their needs, users will take the time to learn how the more complicated system works. And we’ll see later on that the cyberspace of Johnny Mnemonic is not purely graphical and does allow symbolic interaction.

Dradis Console

image09

Dradis is the primary system that the Galactica uses to detect friendly and enemy units beyond visual range.  The console appears to have a range of at least one light second (less than the distance from Earth to the Moon), but less than one light minute (one/eighth the distance from Earth to the Sun).

How can we tell?  We know that it’s less than one light minute because Galactica is shown orbiting a habitable planet around a sun-like star.  Given our own solar system, we would have at least some indication of ships on the Dradis at that range and the combat happening there (which we hear over the radios).  We don’t see those on the Dradis.

We know that it’s at least one light second because Galactica jumps into orbit (possibly geosynchronous) above a planet and is able to ‘clear’ the local space of that planet’s orbit with the Dradis

image03

The sensor readings are automatically interpreted into Friendly contacts, Enemy contacts, and missiles, then displayed on a 2d screen emulating a hemisphere. A second version of the display shows a flat 2d view of the same information.


Friendly contacts are displayed in green, while enemy units (Cylons) are displayed in red.  The color of the surrounding interface changes from orange to red when the Galactica moves to Alert Stations.

image06

The Dradis is displayed on four identical displays above the Command Table, and is viewable from any point in the CIC.  ‘Viewable’ here does not mean ‘readable’.  The small size, type, and icons shown on the screen are barely large enough to be read by senior crew at the main table, let alone officers in the second or third tier of seating (the perspective of which we see here).

It is possible that these are simply overview screens to support more specific screens at individual officer stations, but we never see any evidence of this.

Whatever the situation, the Dradis needs to be larger in order to be readable throughout the CIC and have more specific screens at officer stations focused on interpreting the Dradis.

As soon as a contact appears on the Dradis screen, someone (who appears to be the Intelligence Officer) in the CIC calls out the contact to reiterate the information and alert the rest of the CIC to the new contact.  Vipers and Raptors are seen using a similar but less powerful version of the Galactica’s sensor suite and display.  Civilian ships like Colonial One have an even less powerful or distinct radar system.


2d display of 3d information

The largest failing of the Dradis system is in its representation of the hemisphere.  We never appear to see the other half of the sphere. Missing half the data is pretty serious. Theoretically, the Galactica would be at the center of a bubble of information, instead of picking an arbitrary ‘ground plane’ and showing everything in a half-sphere above that (cutting out a large amount of available information).

The Dradis also suffers from a lack of context: contacts are displayed in 3 dimensions inside the view, but only have 2 dimensions of reference on the flat screen in the CIC.  For a reference on an effective 3d display on a 2d screen, see Homeworld’s (PC Game, THQ and Relic) Sensor Manager:

image04

In addition to rotation of the Sensor Manager (allowing different angles of view depending on the user’s wishes), the Sensor Manager can display reference lines down to a ‘reference plane’ to show height above, and distance from, a known point.  In Homeworld, this reference point is often the center of the selected group of units, but on the Dradis it would make sense for this reference point to be the Galactica herself.

image07

Dradis Contact

Overall, the crew of the Galactica never seems to be inhibited by this limitation.  The main reasons they could be able to work around this limitation include:

  • Extensive training
  • Effective communication between crew members
  • Experience operating with limited information.  

This relies heavily on the crew operating at peak efficiency during an entire combat encounter.  That is a lot to ask from anyone.  It would be better to improve the interface and lift the burden off of a possibly sleep deprived crewmember.

The Dradis itself displays information effectively about the individual contacts it sees.  This isn’t visible at the distances involved in most CIC activities, but would be visible on personal screens easily.  Additionally, the entire CIC doesn’t need to know every piece of information about each contact.

In any of those three cases, crew efficiency would be improved (and misunderstandings would be limited) by improving how the Dradis displayed its contacts on its screen.

Security Alert

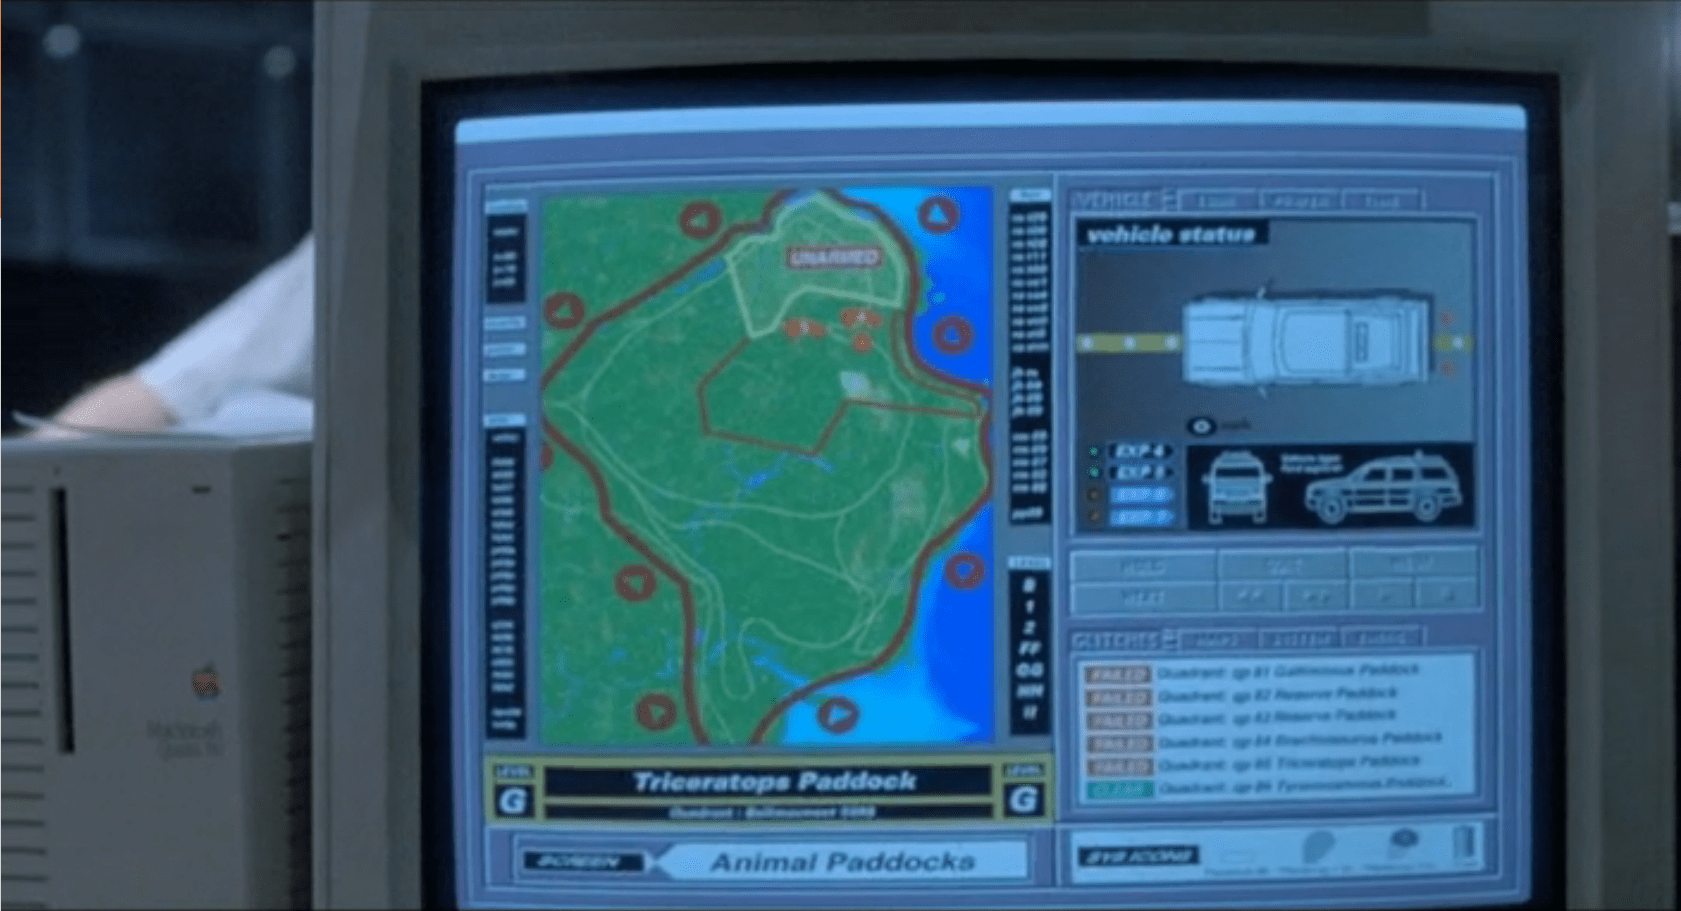
The security alert occurs in two parts. The first is a paddock alert that starts on a single terminal but gets copied to the big shared screen. The second is a security monitor for the visitor center in which the control room sits.  Both of these live as part of the larger Jurassic Park.exe, alongside the Explorer Status panel, and take the place of the tour map on the screen automatically.

Paddock Monitor

After Nedry disables security, the central system fires an alert as each of the perimeter fence systems go down.  Each section of the fence blinks red, with a large “UNARMED” on top of the section.  After blinking, the fence line disappears. To the right is the screen for monitoring vehicles.

image01
image03

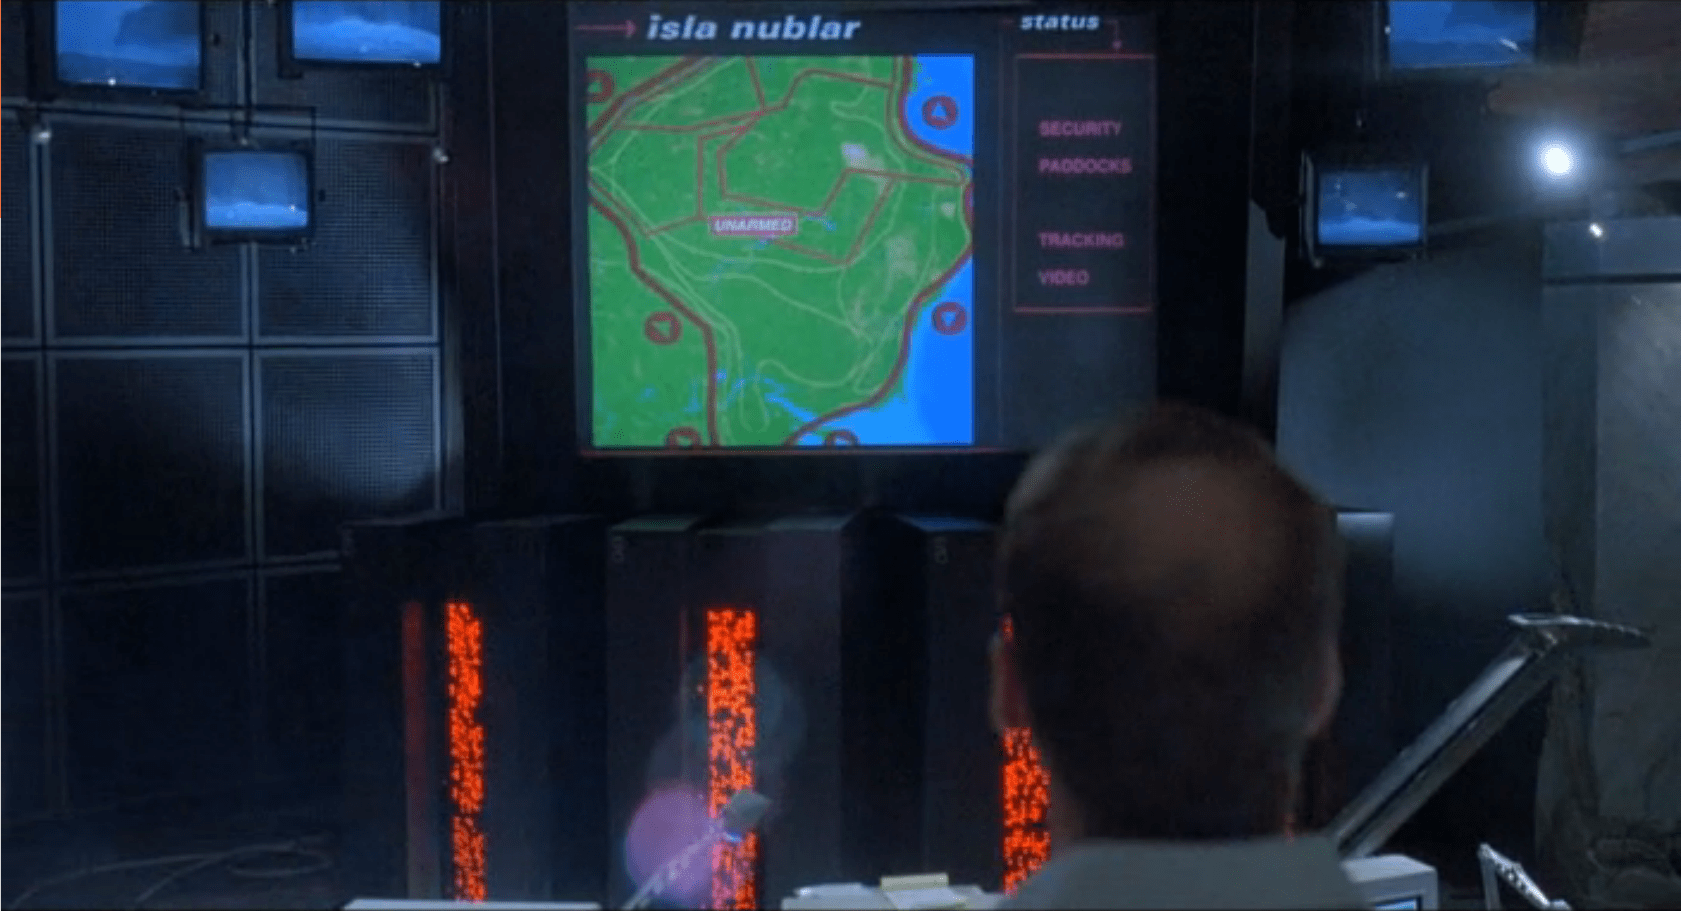
As soon as the system starts detecting the disabled fences, it starts projecting the fence security diagram onto the main screen at the front of the Control Room for everyone to see, but with a status bar on the right reading “SECURITY, PADDOCKS, TRACKING, and VIDEO.”

image00

Visitor Center

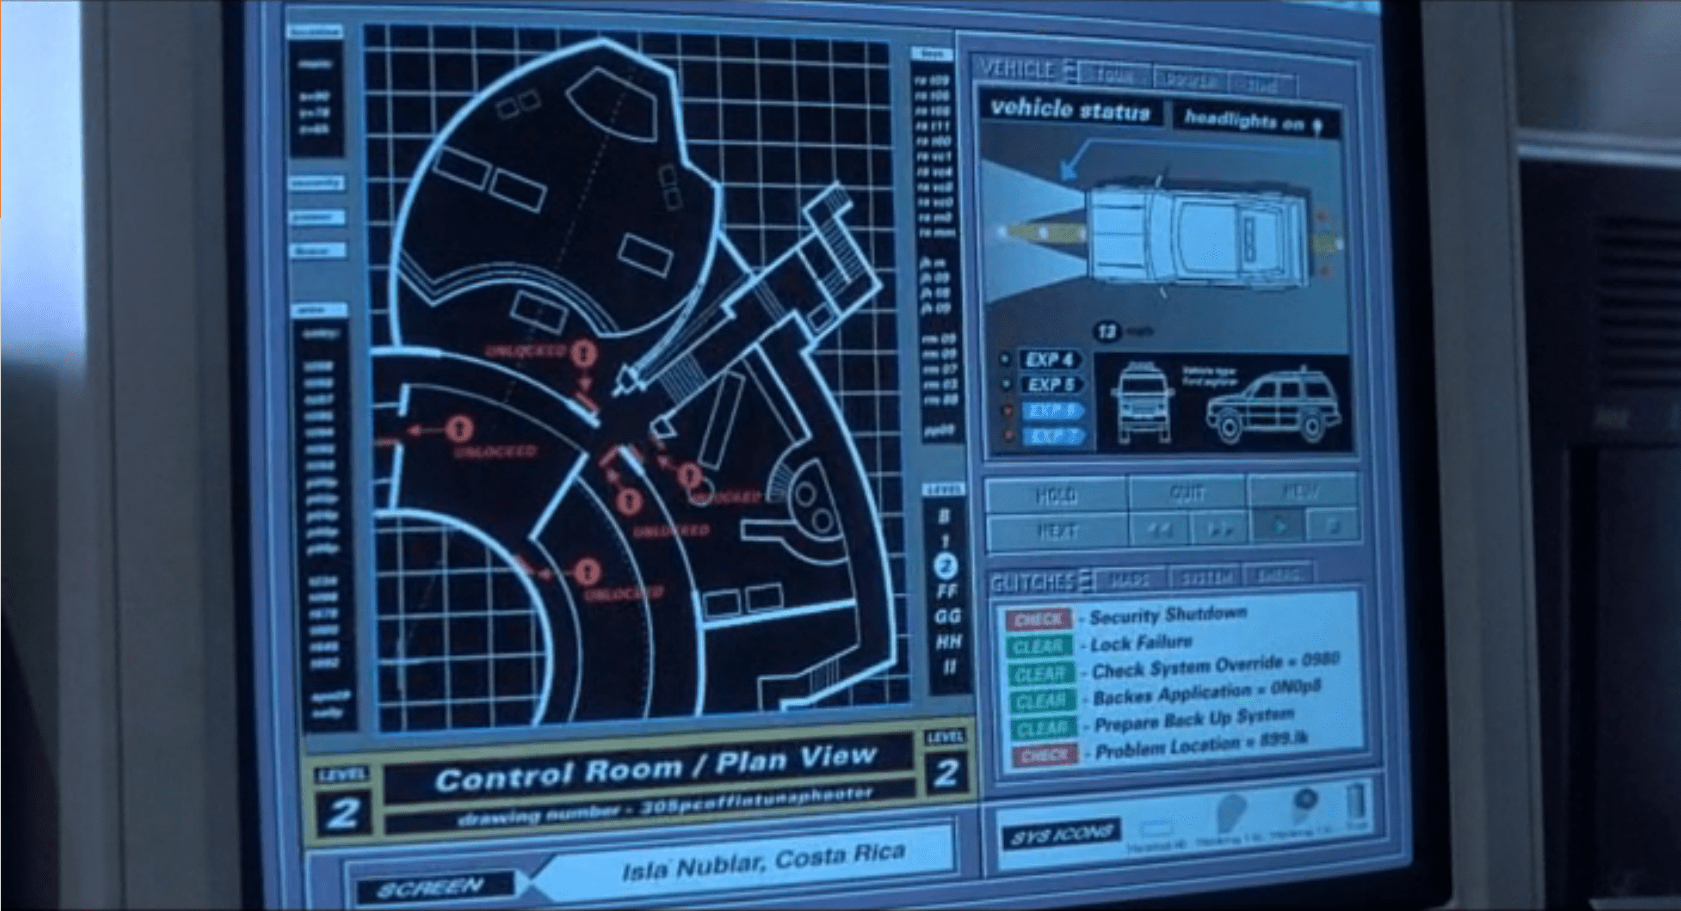
The system has a second screen showing security measures in the visitor center itself.  It focuses on the security doors between public and private areas (dining, halls, the genetics lab, and the cryostorage).

image02

In both cases, these security screens appear on the same computer showing the vehicle status.  It replaces the island map.  This isn’t a separate program, but is instead a replacement window, as shown by the identical data in the columns to the left and right of the map view.

Don’t Break Existing Mental Models

Throughout the security panels, there isn’t any consistency in color labeling.  On the fences, red is good.  On visitor center map, red is bad.  On the glitches panel, red means that it should be looked at, but might not be bad.

First, accessibility standards say that color shouldn’t be the only indicator of status.  Thankfully for this interface and its inconsistency, it at least has labeling. But that means that an operator needs to either memorize the entire panel before they can be proficient at it, or read each label every time.

Second, color standardization could be done with a little more creative background colors.  Picking more neutral backgrounds—for example, the island on the fence map doesn’t need to be bright green, and could either be desaturated or a basic light grey—would allow the status colors to show up better and have more readable text.

Third, while the status indicators are labeled, the labels are written in system language instead of user language.  “Clear” and “Check” can be understood with some work, but aren’t natural status labels in day-to-day society.

Keep Indicators

When the fences deactivate, they disappear off the screen.  While this does show that they’re disabled, it removes the control room crew’s ability to quickly see what they can fix and where it is.  Unless a room full of experts is looking at the screen, they won’t know where the T-Rex fence is and where to send work crews.  Keeping the fences on the screen in a ‘disabled’ or ‘broken’ state would indicate the same information, while still providing direction.

The visitor center screen almost gets this right by changing the color, changing the label, and showing the door as open on the panel.  Practically, this is what’s happening (the ‘Raptors can get through any door they want), but realistically some of those doors are actually closed.

In the case of the doors, it would make more sense to have the status change, but only have the door open if the system actually detects a door opening in the building.

Show the ’Raptors

This is the most critical screen in the park during an emergency, but it isn’t showing a critical status: The Velociraptor Pen.

Arnold has to roll over to the command console computer and type in a manual status request to learn that the raptor pen fences are still active.  Given how important this status is to everyone in the park, it should be on the main map in some form or another.

Additionally, the system could show the status of secondary systems in a side pane:

  • Tour status
  • Camera feeds
  • Where dinosaurs are
  • What secondary equipment status is

When things start to go wrong on the island, this interface should provide guidance to the control room crew on what they need to do and what they need to fix (even if, in this case, the answer is “Everything”).

Organizing information, mapping status across screens, and providing lists of what needs to be fixed would give an understandable checklist to the park staff on what they should be doing.

Iron Man HUD: Just the functions

In the last post we went over the Iron HUD components. There is a great deal to say about the interactions and interface, but let’s just take a moment to recount everything that the HUD does over the Iron Man movies and The Avengers. Keep in mind that just as there are many iterations of the suit, there can be many iterations of the HUD, but since it’s largely display software controlled by JARVIS, the functions can very easily move between exosuits.

Gauges

Along the bottom of the HUD are some small gauges, which, though they change iconography across the properties, are consistently present.

IronMan1_HUD07

For the most part they persist as tiny icons and thereby hard to read, but when the suit reboots in a high-altitude freefall, we get to see giant versions of them, and can read that they are:

IronMan1_HUD13
Tony can, at a glance or request, summon more detail for any of the gauges.
IronMan1_HUD12
Even different visualizations of similar information.

Object Recognition

In the 1st-person view we see that the HUD has a separate map in the lower-left, and object recognition/awareness,

IronMan1_HUD10
IronMan1_HUD11
In the 2nd-person view, we see even more layers of information about the identified objects, floating closer to tony’s point of view.

Situational

Most of the HUD functions we see, though, are situational, brought up for Tony’s attention when JARVIS believes they are needed, or when Tony requests them. Following are screenshots that illustrate a moment when the situational function appeared. 

Iron Man

Iron Man 2

Iron Man 3

The Avengers

Some of these illustrate why I argue that JARVIS is the superhero, and Tony just the onboard manager, but rather than reverse engineering any particular function, for this post it is enough to document them and note that only the optical zoom seems to be an interactive function. This raises questions of how he initiated the mode and how he escapes the mode, but since we don’t see the mechanisms of control, it’s entirely arguable that JARVIS is just  being his usual helpful self again.

Next up in the Iron HUD series: Let’s dive deeper into the first-person view.

Ford Explorer Status

image00

One computer in the control room is dedicated to showing the status of the Jeeps out on tour, and where they currently are on the island.

Next to the vehicle outline, we see the words “Vehicle Type: Ford Explorer” (thank you, product placement) along with “EXP” 4–7.  EXP 4 & 5 look unselected, but have green dots next to them, while EXP 6 & 7 look selected with red dots next to them.  No characters interact with this screen. Mr. Arnold does tap on it with a pen (to make a point though, not to interact with it).

On the right hand side of the screen also see a top-down view of the car with the electric track shown underneath, and little red arrows pointing forward.  Below the graphic are the words “13 mph”.  The most visible and obvious indicator on the screen is the headlights.  A large “Headlights On” indicator is at the top of the screen, with highlighted cones coming out of the Jeep where the headlights are on the car.

Jumbled Hierarchy

It is very difficult to tell from this page what the most important systems on the tour are.  The most space and visual weight is given to the car itself and its headlights, but we never see any data on the actual car itself. Did Hammond’s deal with Ford include constant advertising to his handful of tour monitors?

When Drs. Grant and Sattler leave the jeep to walk out into the park, we only see two doors open; but all four doors show as open on the main projector status display in the control room.

Probably an editing error, but with Nedry programming things, who can say?
They can remote control the steering wheel and pedals, but not the locks?Probably an editing error, but with Nedry programming things, who can say?
image01
Probably an editing error, but with Nedry programming things, who can say?

At best, the system is attempting to display a binary indicator (doors open/doors closed) based on limited data.  At worst, the system is unreliable and can’t be trusted to deliver even basic status information correctly.

We also see several buttons that are labeled like they should be active, such as “Hold”, “Quit”, “New”, and “Next”.  What could this mean?

  • Erroneous labels indicating action where there is none
  • Disabled buttons because they aren’t appropriate for where the Jeeps are right now
  • Something that could be active in the future when more coding is done.

Ideally, these are indicating normal actions that aren’t available right now.  The control team would still need to be trained on why they’re disabled and when they’re active, which puts an unnecessary burden on their memory. That information should be apparent in any interface on which lives depend.

Missing Information

Many systems appear to be missing from this display, or are indicated in a way that is too cryptic to easily identify:

  • Self driving features?
  • Basic diagnostic info, like oil temp and tire pressure?
  • What event is playing in the Jeep?

It could also be improved with information that the system can surely collect.  Trend information would be the most useful:

  • How efficiently is the Jeep moving?
  • Is it breaking down?
  • What kind of baseline is the tour establishing?
  • Has it been accelerating or decelerating? At what rate?

While you’re an unethical capitalist, there is even information that could be used to track the effectiveness of the park, by tracking the affective states of the passengers in the car:

  • Heartrate
  • Motion within the car (direction, proximity to windows)
  • Breath rate
  • Skin temperature
  • Conversation (and valence): words, pace, and pitch

At their least offensive, this data would be anonymously aggregated and analyzed by location to understand where the experience can be improved. Where is the tour the most boring? Most exciting? Where are the passengers most likely to view dinosaurs (and should have their attentions keyed)? You could also use the information in real time to know when there is likely a problem that needs the attentions of a remote operator.

Finally, if you have cameras on the vehicles, you have another data collection channel such that the system could compare views of the road and paddocks, compare to prior images, and know when there are plants that need trimming away from the rail, or when deformations appear in the walls and need attention from maintenance teams. Heck, you could turn those sensors into an upsell opportunity. Charge a few extra bucks, and friends and family back home can go on the live tour with you, or you could sell a 360° video back to the riders as a souvenir. Dinobucks to be made, here, people.

The Map

One of the few pieces that is straight-forward here is the map.  We see a dot for where the tour is, the number and type of vehicles on the tour, and location information.  For a single tour, this would probably work well.

It would be a nightmare with more than one tour out in the field at a time.

With more than a handful of vehicles out on the island with the current information density, the display would quickly be overwhelmed with numbers overlapping each other and changing constantly making it impossible to read.  The large vehicles too might overlap more important information, like the terrain or possible problem areas on the tracks.

Color contrast is an issue here too: green on green would be very difficult to see for anyone without perfect color vision.  If the color was the only thing to change on a change in status from good to bad, the color green is also an issue because of how many other colors it conflicts with.  Accessibility would be improved by choosing a color like blue, or adding an outline to the dot.

_Map
scifiinterfaces comp.

Better would be to have a basic icon for each tour on the map, and a basic color/label combination next to the icon to show a “nominal” status.  The icon could also be an indicator of how many vehicles were in the tour.

If something happened, the icon status could change to a different color, and the label would change to the new status. Icons would make that information more glanceable. Additional info would flow onto the screen for just that tour.

This would provide a clear indicator of which tour on the map to pay attention to, and what was broken about it.

Overall

I would hope that this wasn’t a screen that I would have to look at day-in, day out.  The entire future control crew of Jurassic Park was lucky they weren’t forced to deal with this. But, with a few tweaks to the map and a complete reorganization of the information on the Jeep Status screen, it might become usable.

Weather Monitor

Jurassic Park’s weather prediction software sits on a dedicated computer. It pulls updates from some large government weather forecast (likely NOAA).  The screen is split into three sections (clockwise from top left):

  1. 3D representation of the island and surrounding ocean with cloud layers shown
  2. plan view of the island showing cloud cover
  3. A standard climate metrics along the bottom with data like wind direction (labeled Horizontal Direction), barometric pressure, etc.

We also see a section labeled “Sectors”, with “Island 1” currently selected (other options include “USA” and “Island 2”…which is suitably mysterious).

JurassicPark_weather01

Using the software, they are able to pan the views to the area of ocean with an incoming tropical storm.  The map does not show rainfall, wind direction, wind speed, or distance; but the control room seems to have another source of information for that.  They discuss the projected path of the storm while looking at the map.

JurassicPark_weather03

Missing Information

The park staff relies on the data from weather services of America and Costa Rica, but doesn’t trust their conclusions (Muldoon asks if this storm will swing out of the way at the last second despite projections, “like the last one”).  But the team at Jurassic Park doesn’t have any information on what’s actually happening with the storm.

Unlike local weather stations here in the U.S., or sites like NOAA weather maps, there is in this interface a lack of basic forecasting information like, say, precipitation amount, precipitation type, individual wind speeds inside the storm, direction, etc… Given the deadly, deadly risks inherent in the park, this seems like a significant oversight.

The software has spent a great deal of time rendering a realistic-ish cloud (which, we should note looks foreshadowingly like a human skull), but neglects to give information that is taken for granted by common weather information systems.

Prediction

When the park meteorologist isn’t on duty, or isn’t awake, or has his attention on the Utahraptor trying to smash its way into the control room, the software should provide some basic information to everyone on staff:

  • What does the weather forecast look like over the next few hours and days?

When the weather is likely to be severe, there’s more information, and it needs to urgently get the attention of the park staff.

  • What’s the prediction?
  • Which parts of the park will be hit hardest?
  • Which tours and staff are in the most dangerous areas?
  • How long will the storm be over the island?

If this information tied into mobile apps or Jurassic Park’s wider systems, it could provide alerts to individual staff, tourists, and tours about where they could take shelter.

JurassicPark_weather02

Make the Information Usable

Reorienting information that is stuck on the bottom bar and shifting it into the 3d visual would lower the cognitive load required to understand everything that’s going on.  Adding in visuals for other weather data (taken for granted in weather systems now) would bring it at least up to standard.

Finally, putting it up on the big monitor either on demand or when it is urgent would make it available to everyone in the control room, instead of just whoever happened to be at the weather monitor. Modern systems would push the information information out to staff and visitors on their mobile devices as well.

With those changes, everyone could see weather in real time to adjust their behavior appropriately (like, say, delaying the tour when there’s a tropical storm an hour south), the programmer could check the systems and paddocks that are going to get hit, and the inactive consoles could do whatever they needed to do.

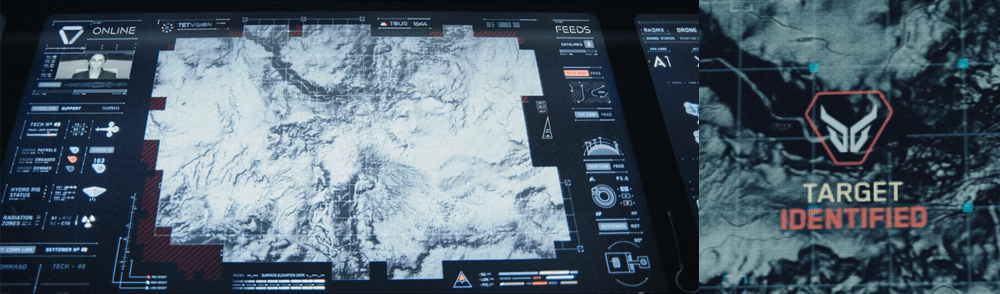
TETVision

image05

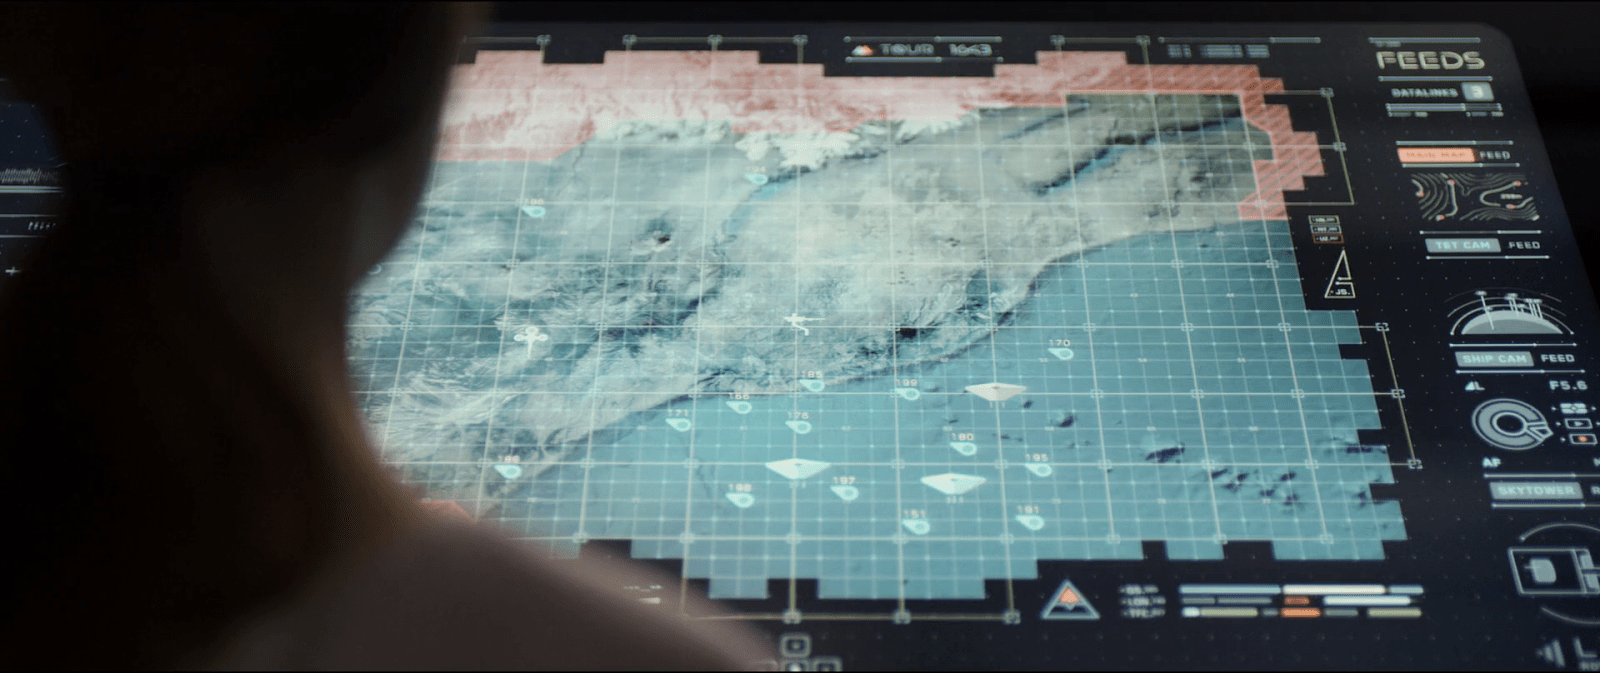
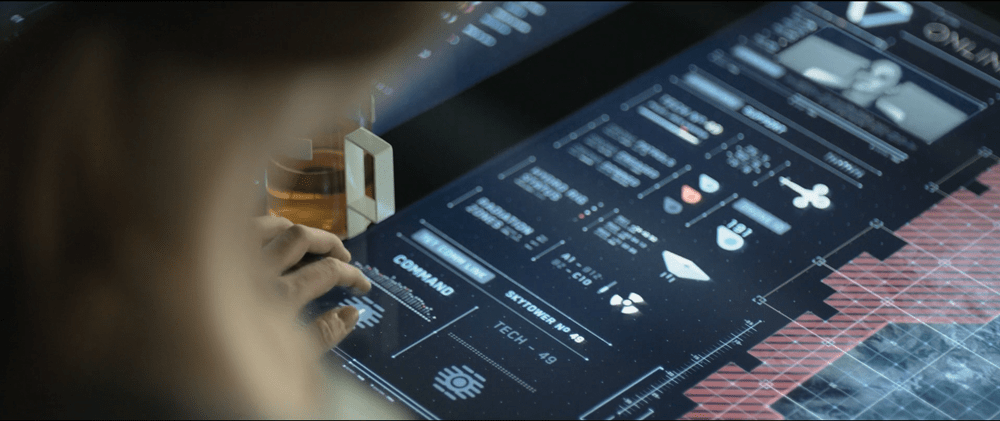
The TETVision display is the only display Vika is shown interacting with directly—using gestures and controls—whereas the other screens on the desktop seem to be informational only. This screen is broken up into three main sections:

  1. The left side panel
  2. The main map area
  3. The right side panel

The left side panel

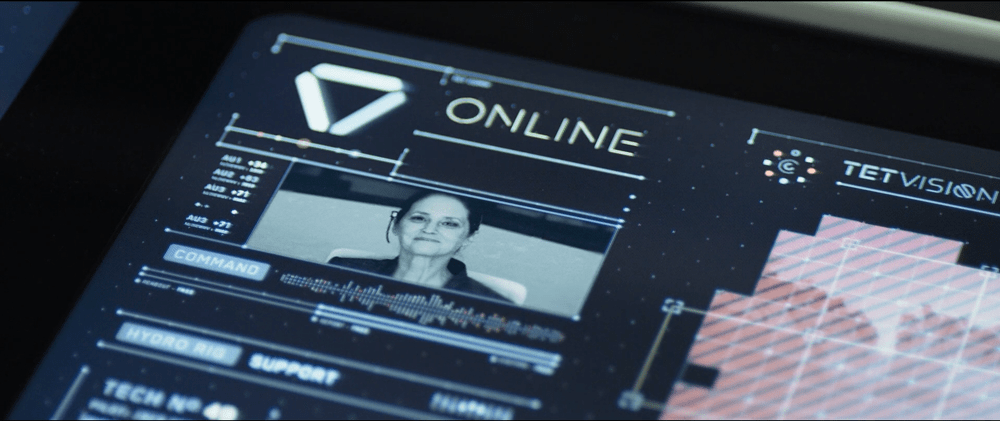
The communications status is at the top of the left side panel and shows Vika the status of whether the desktop is online or offline with the TET as it orbits the Earth. Directly underneath this is the video communications feed for Sally.

Beneath Sally’s video feed is the map legend section, which serves the dual purposes of providing data transfer to the TET and to the Bubbleship as well as a simple legend for the icons used on the map.

The communications controls, which are at the bottom of the left side panel, allow Vika to toggle the audio communications with Jack and with Sally.

The main map area

The largest section is the viewport where the various live feeds are displayed. The main map, which serves as a radar, as well as the remote video feeds she uses to monitor Jack are both in this section of the display.

The right side panel

The panel on the right side of the map contains the video feed controls, which allow Vika to toggle between live footage from the Bubbleship, the TET, and of course, the main map view.

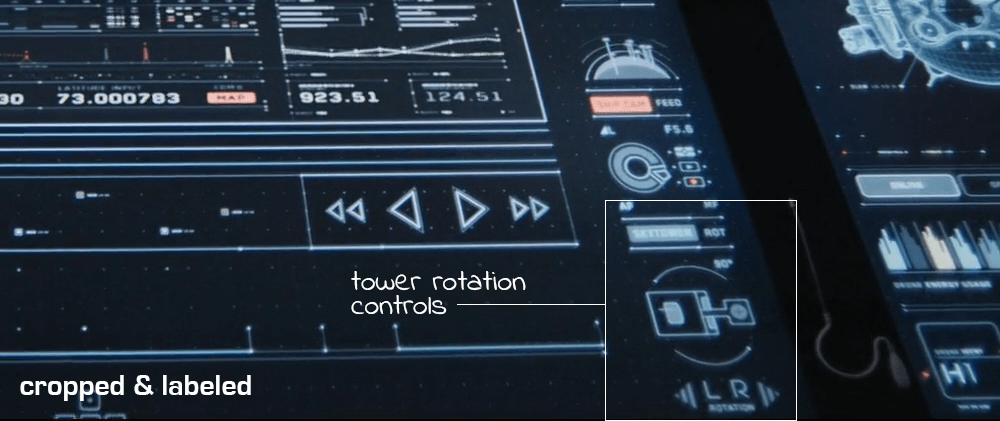
Although never shown in use in the film, the bottom right of the screen houses the tower rotation controls. This unused control is the only indication the capability even exists, so it is unknown whether the tower rotates 360 degrees or whether it’s limited to set points. (More on this below.)

It has robust capabilities

image02

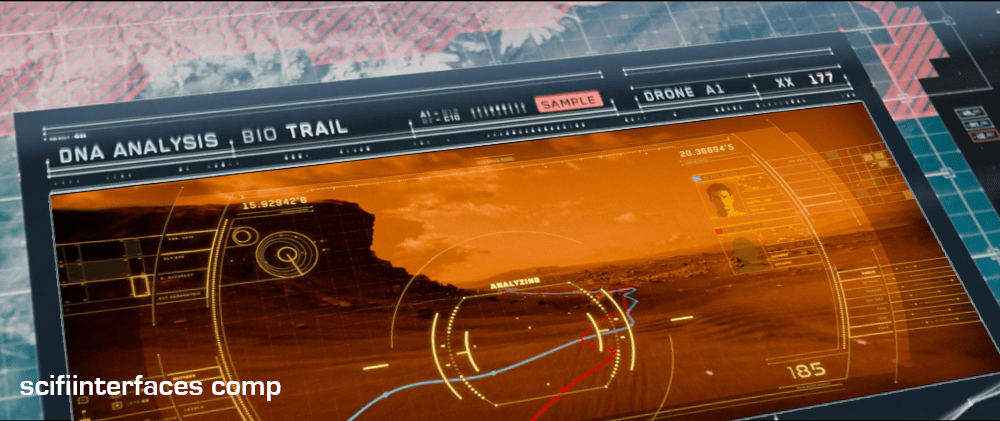
At one point in the movie, Vika is able to use the drones to search for bio trail signatures when Jack is abducted by the scavs.

image06

Vika is also able to detect and decode various types of signals such as the morse code message sent by Jack or the rogue signal sent out by the scavs.

image08

And, probably unbeknownst to Jack and Vika, the TETVision can be controlled remotely from the TET to allow Sally access to the data stored on the desktop—as shown at one point in the movie, when Sally pulls up a past bio trail signature to send drones after Jack and the scavs.

It’s missing a critical layer of data

image03

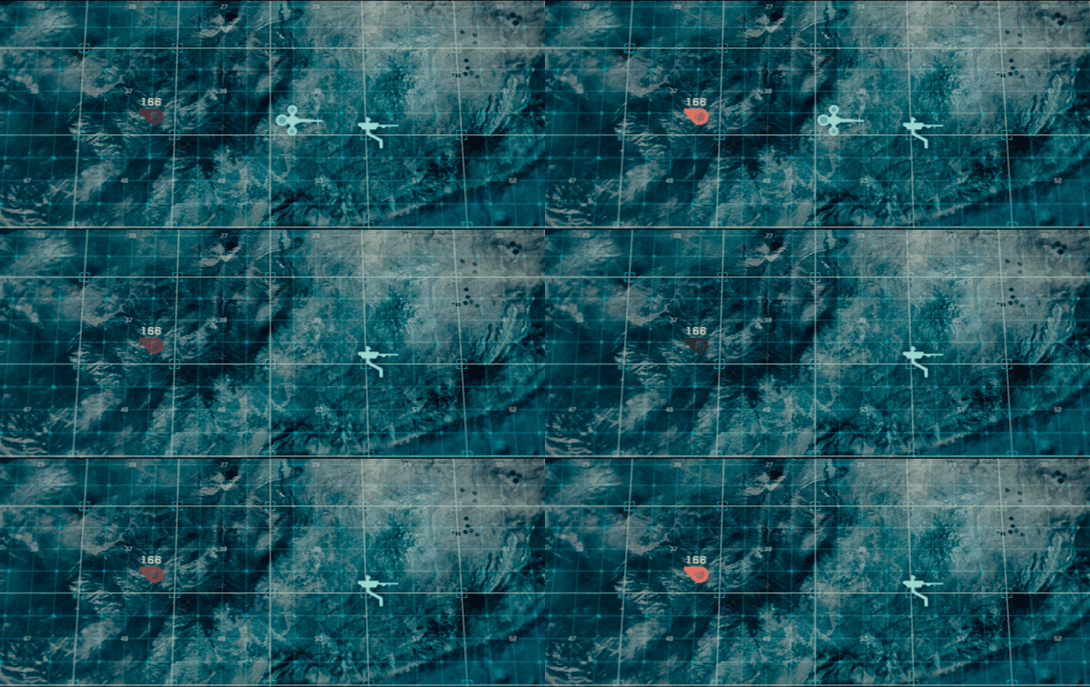
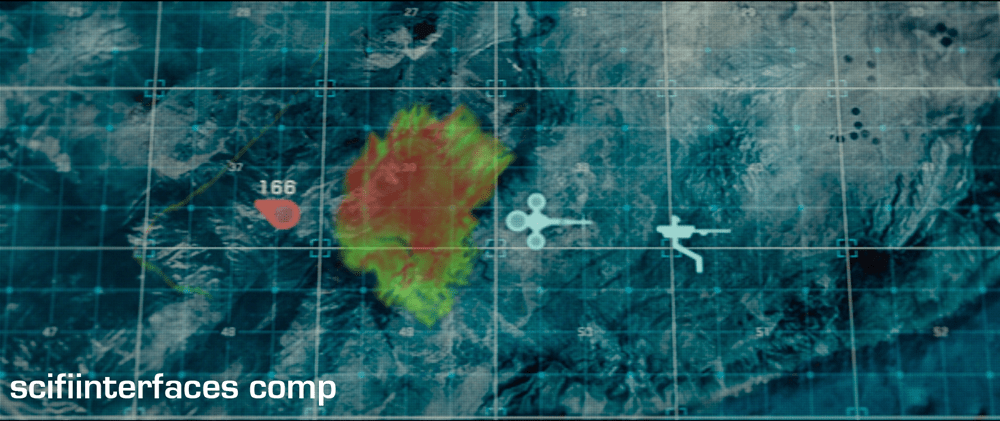
At the beginning of the film, as Jack heads toward the downed drone 166, he suddenly encounters a dangerous lightning storm and nearly plunges to his death when the Bubbleship loses power. His signature disappears from the TETVision map, but from Vika’s perspective there is no indication as to what could have happened — or that there was any danger to begin with.

image01

Since the weather is unstable and constantly changing, it would have been better to include a weather overlay so that Vika could have notified Jack of the storm—allowing him to fly around it instead of straight into it.

It’s got some useless bits

image09

The tower rotation controls are never shown in use in the film, so it’s not clear what benefit rotating the tower would serve. The main purpose of their mission is to ensure the hydro-rigs are secure and functioning properly, not getting an optimal view.

image04

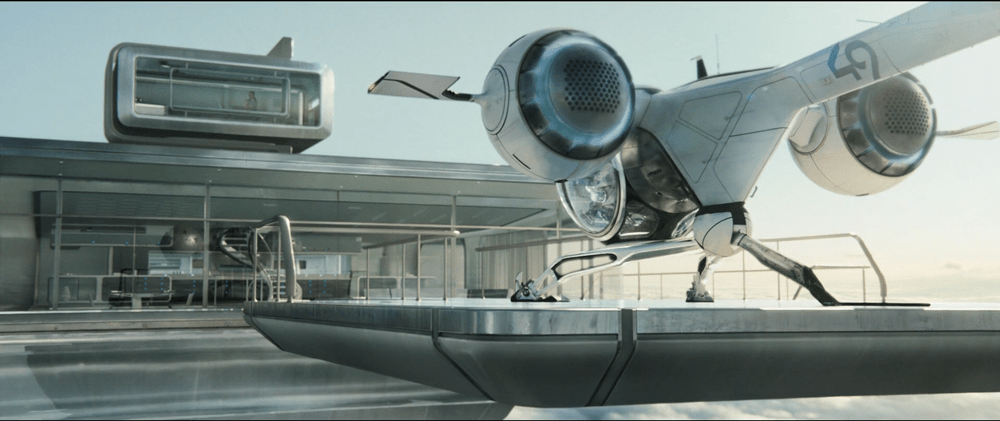
The tower is almost completely surrounded by windows as it is. And since the tower windows already face the hydro-rigs, what would be the benefit of changing vantage points?

It seems that the space could be used for something more beneficial to Vika such as bike, hydro-rig and drone cam feeds. This would provide Vika with more eyes on the ground, allowing her the additional support to keep Jack safe and monitor scav activity.

From an clustering standpoint, it would also fall in line logically with the other feed controls on the right side panel.

And some unnecessary visual feedback

image07

Towards the end of the movie, Sally is trying to find Jack and the scavs. She accesses Vika’s desktop remotely in order to pull up the bio trail records. Although no one is around to see the information, the TETVision displays the process as it happens. Of course, this is necessary for the narrative to progress, but in a real-life situation Sally would only need to see the data on her side—not from the desktop in Tower 49. If they’ve managed interstellar travel, cloning, terraforming, and cognitive reprogramming of alien species, they’re not likely still using VNC. This type of interaction should simply run in the background and not be visible on screen.

Better: Provide useful visuals

When a drone picks up a bio trail signal, a visual of a DNA sequence is displayed. Since the analysis is being conducted by Sally on the TET, it seems that this information isn’t really useful to Vika at all.

image00

From Vika’s point of view it seems like the actual trail would be more important, so why not show a drone cam feed complete with the HUD overlay? She could instantly gain more information by seeing that there are two bio trails—proving that Jack has been captured by the scavs and taken to another location.

Homing Beacon

image04

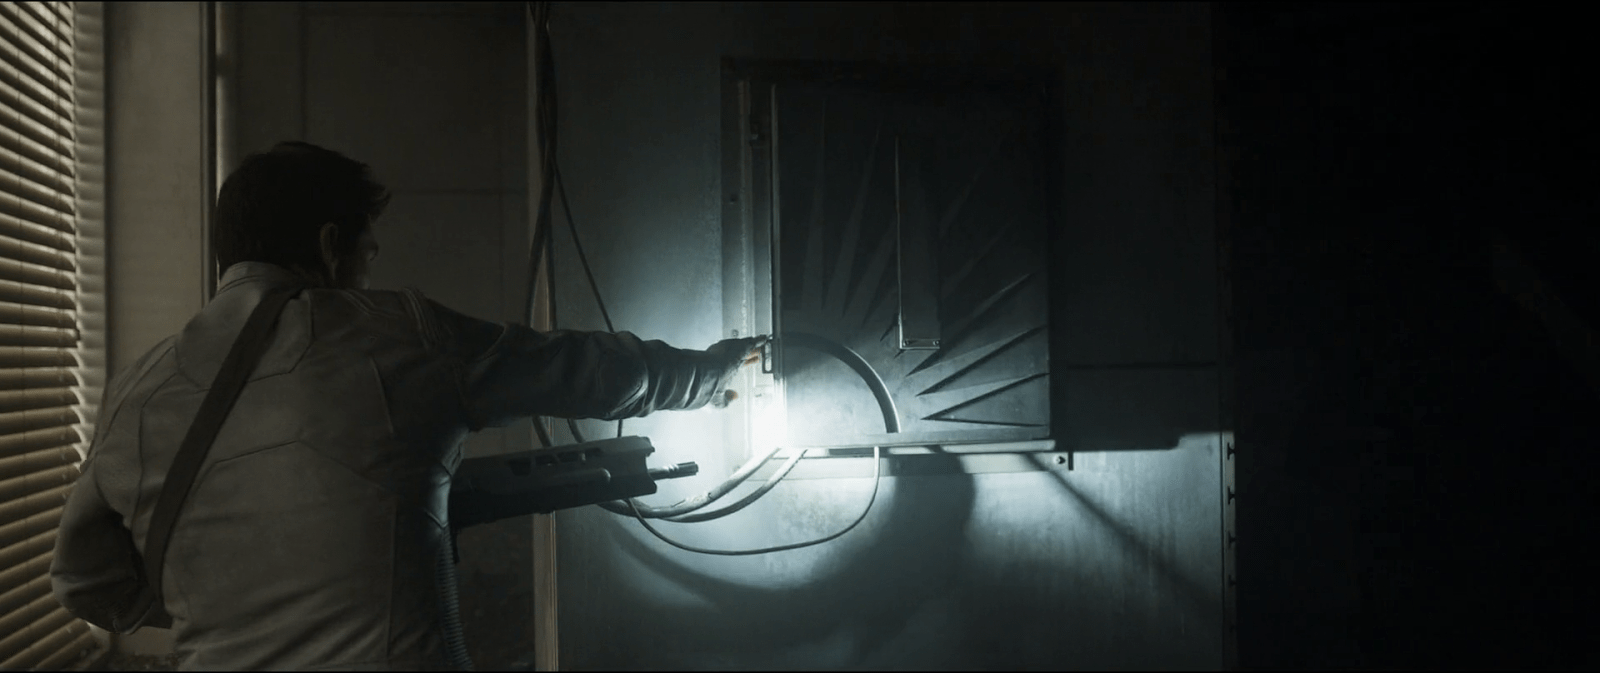
After following a beacon signal, Jack makes his way through an abandoned building, tracking the source. At one point he stops by a box on the wall, as he sees a couple of cables coming out from the inside of it, and cautiously opens it.

The repeater

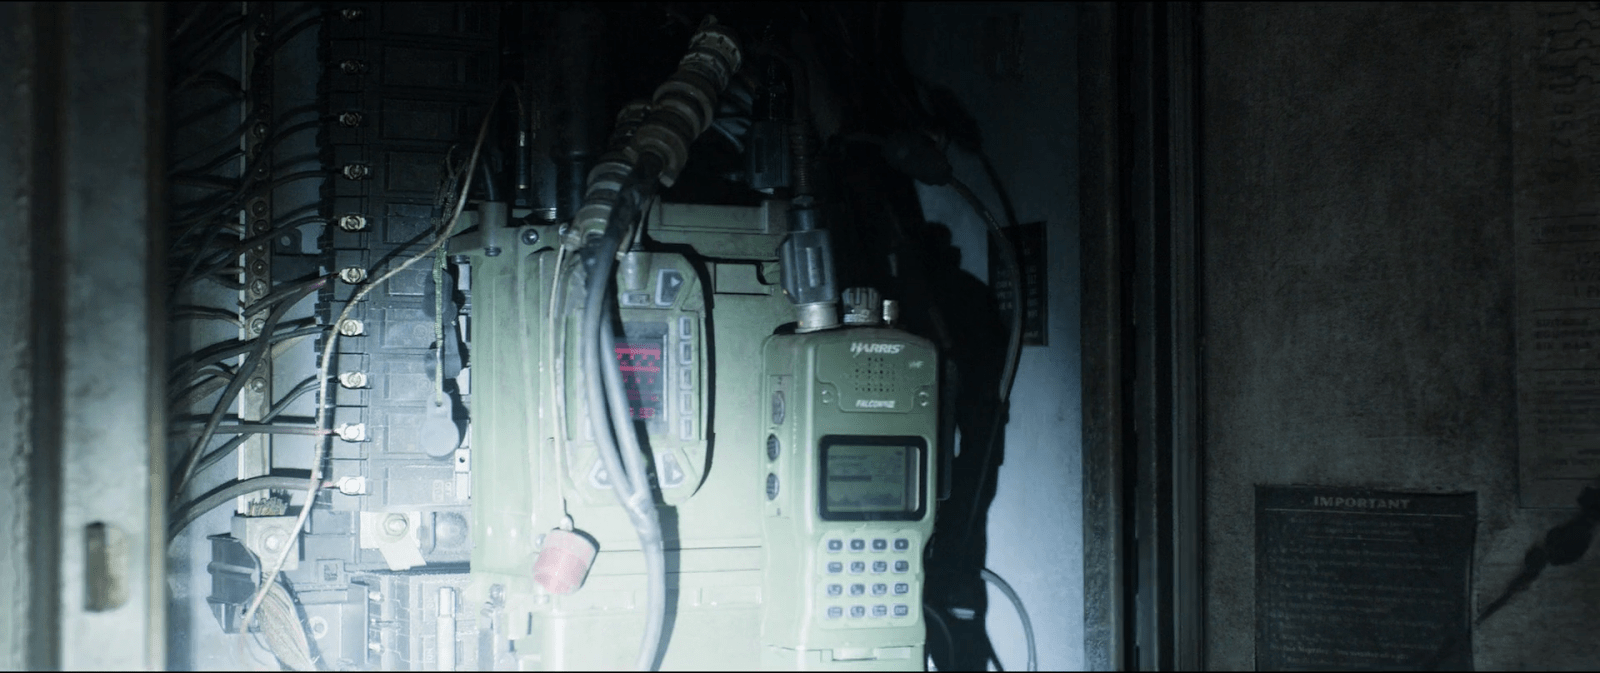
I can’t talk much about interactions on this one given that he does not do much with it. But I guess readers might be interested to know about the actual prop used in the movie, so after zooming in on a screen capture and a bit of help from Google I found the actual radio.

image05
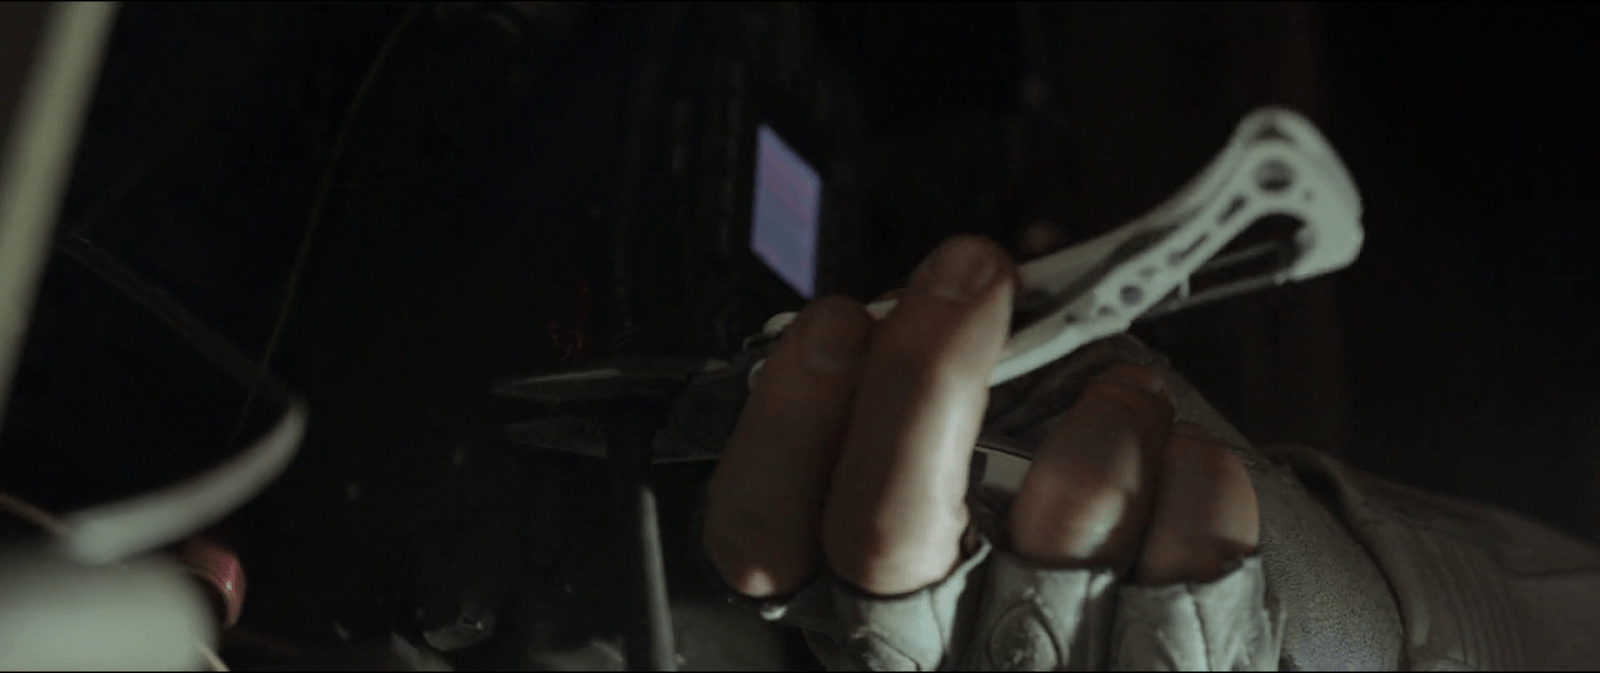
When Jack opens the box he finds the repeater device inside. He realizes that it’s connected to the building structure, using it as an antenna, and over their audio connection asks Vika to decrypt the signal.

The desktop interface

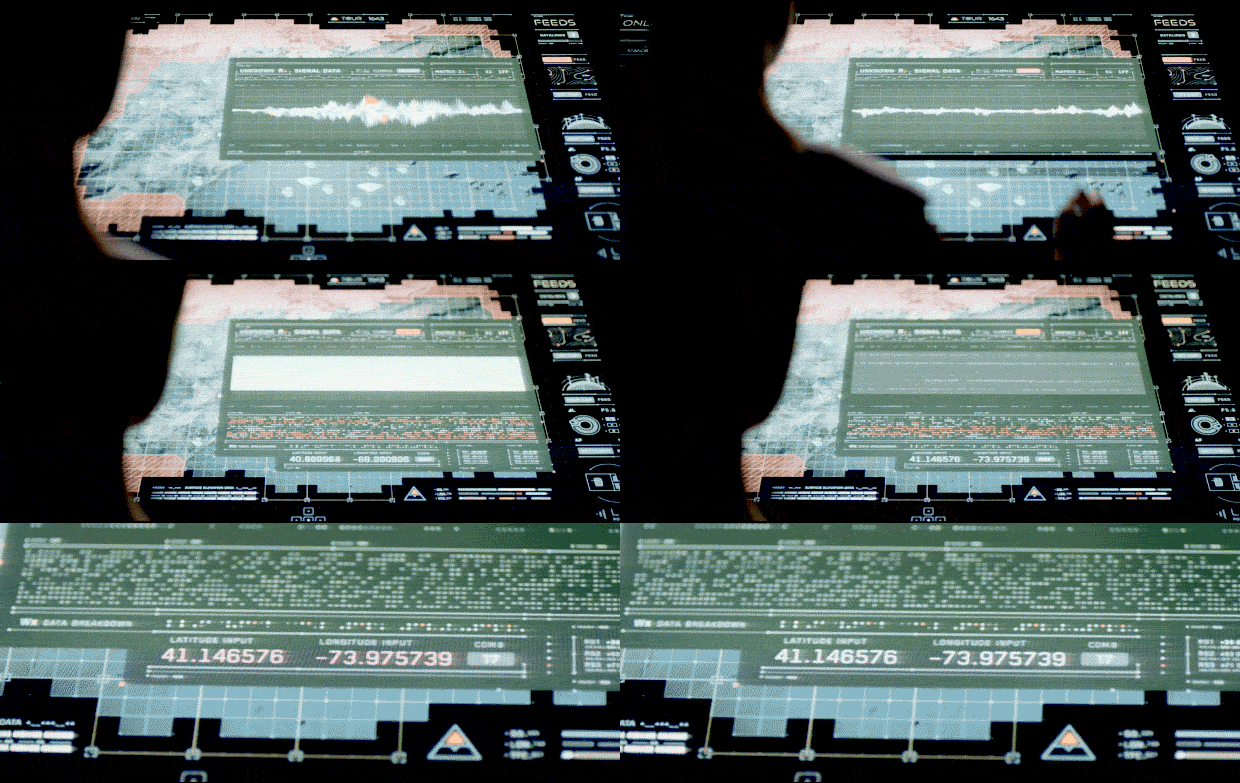
Although this sequence centers around the transmission from the repeater, most of the interactions take place on Vika’s desktop interface. A modal window on the display shows her two slightly different waveforms that overlap one another. But it’s not clear at all why the display shows two signals instead of just one, let aside what the second signal means.

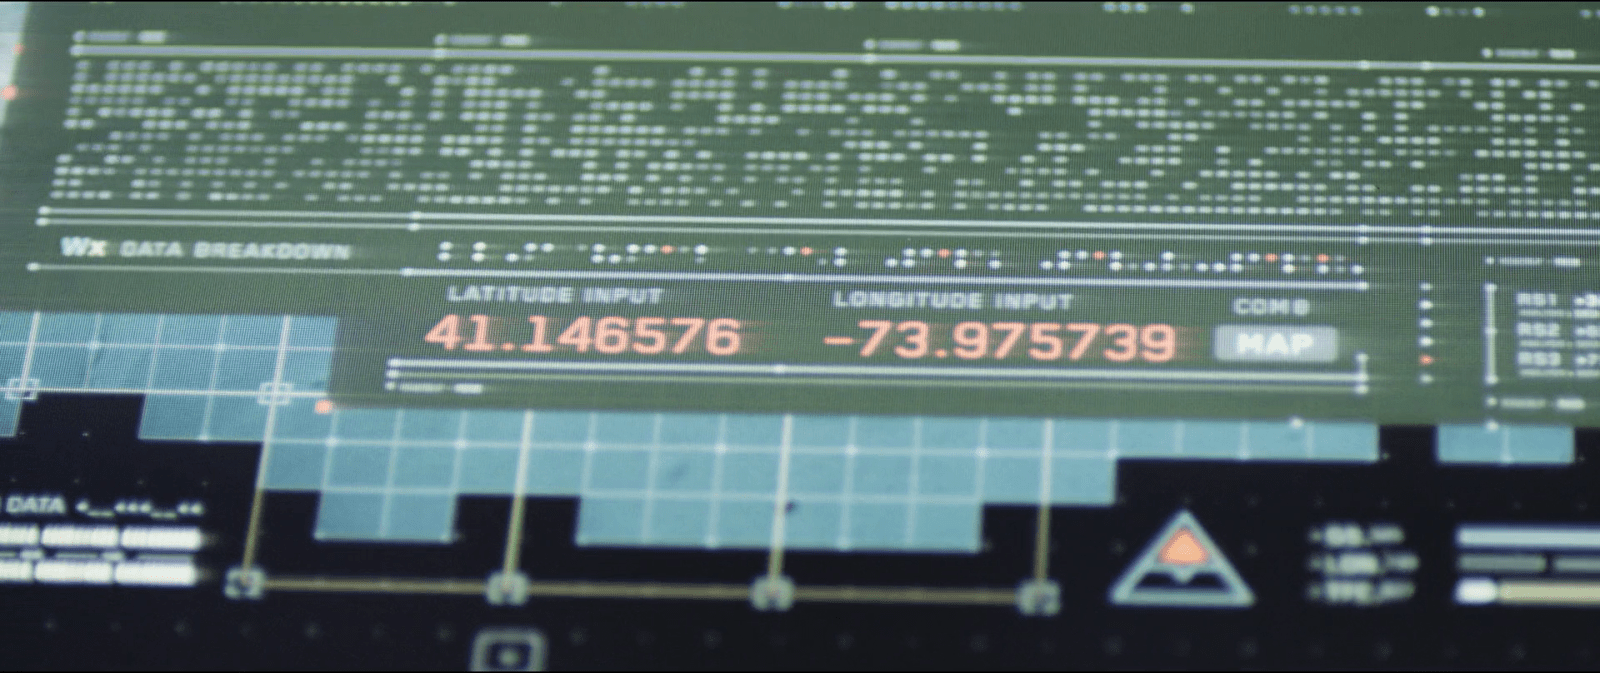
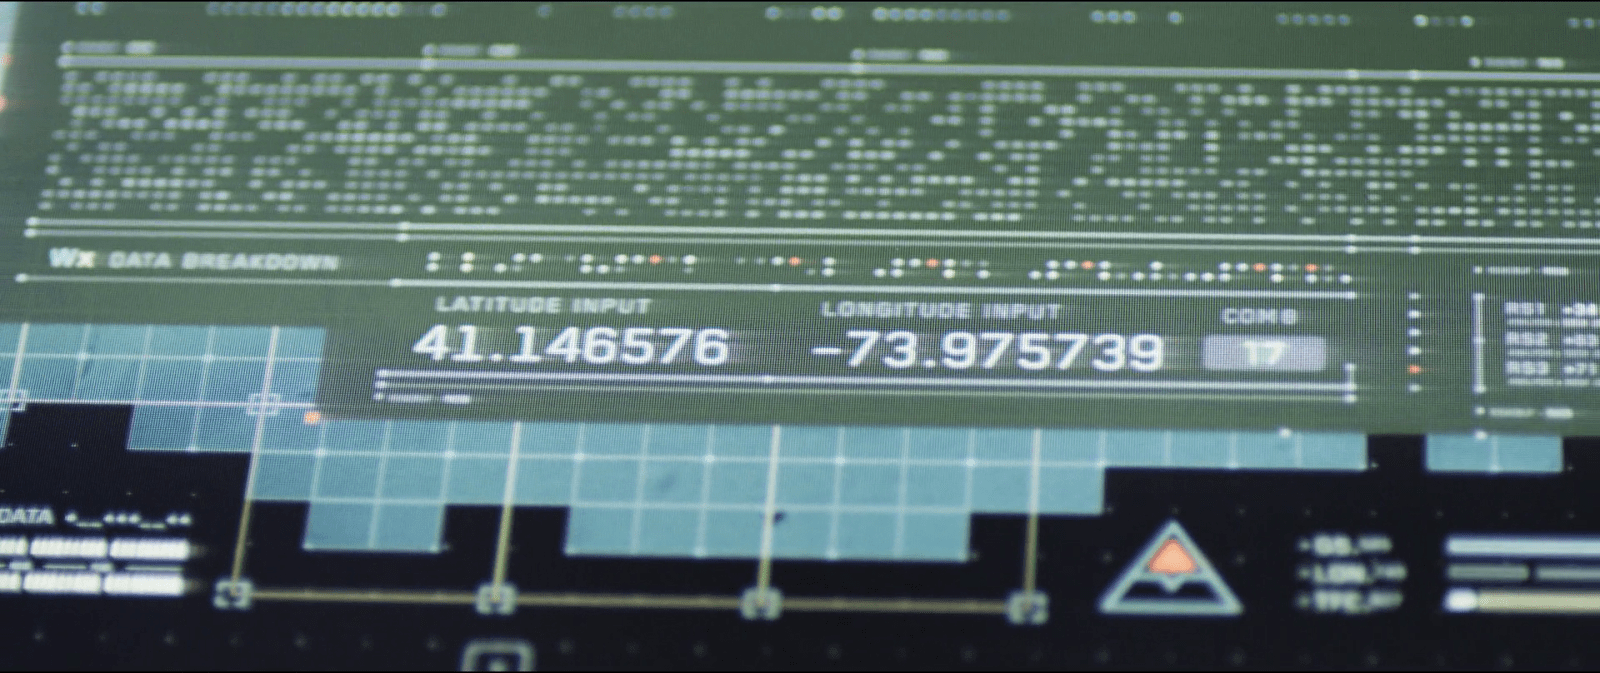
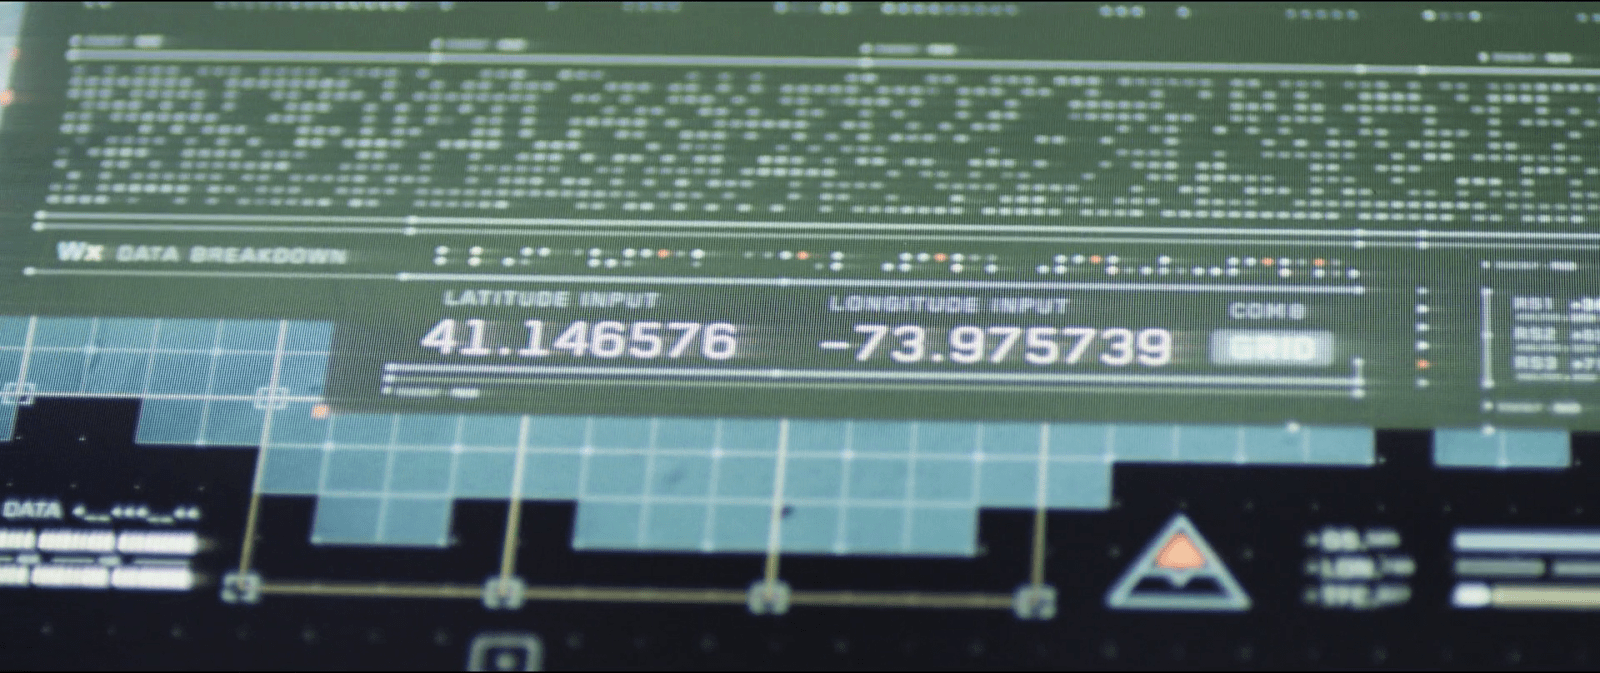
After Jack identifies it as a repeater and asks her to decrypt the signal, Vika touches a DECODE button on her screen. With a flourish of orange and white, the display changes to reveal a new panel of information, providing a LATITUDE INPUT and LONGITUDE INPUT, which eventually resolve to 41.146576 -73.975739. (Which, for the curious, resolves to Stelfer Trading Company in Fairfield, Connecticut here on Earth. Hi, M. Stelfer!) Vika says, “It’s a set of coordinates. Grid 17. It’s a goddamn homing beacon.”

DECODE_15FPS
At the control tower Vika was already tracking the signal through her desktop interface. As she hears Jack’s request, she presses the decrypt button at the top of the signal window to start the process.

When you look at the display, the decrypt button is already there for her to press. So either the computer already knows there is an encryption going on, or the user can press the decrypt button at any time, regardless of whether the signal is encrypted or not. In both cases, it’s bad interaction design.

An issue of agentive tech

If the computer already knows that the signal is encrypted, why doesn’t it tell her that? It should automatically handle the decryption, alert her that it was decrypted, and show the lat/long results on the screen. If it’s wrong, she can dismiss it. But let’s not rely on her consultation of a stoic guru just to find out. (It doesn’t even make sense from the TET’s perspective.) In this way you simplify the interface—as you no longer need a “decrypt” button—and help Vika and Jack with their goals more effectively.

Needs more states

From the sequence you can tell that the decrypt button has only two states , OFF and ON. To improve the interface, we’d want to have a few more states, indicating CONFIDENCE, PROCESSING, and of course if it’s wrong, the opportunity to DISMISS. Each of these would need specific designing for microinteractions, but these two states aren’t enough.

What if those weren’t coordinates?

When Vika presses the decrypt button we can see it expands the bottom part of the window, adding some encryption-related info. And way at the very bottom the interface there are a couple of labels that read LONGITUDE INPUT and LATITUDE INPUT. Not the best name though since it’s easy to mistake these for the coordinates of the signal source rather than the message itself. The numbers there start to change as the computer seems to be decoding the signal from the repeater, and making the correction on the data on real time.

But the strange bit are those same coordinate inputs. It seems as if the computer already knows—before it finishes decrypting—that the signal is transmitting a set of longitude and latitude coordinates. I mean, what if the encrypted data wasn’t coordinates at all…say, an entry code to some scav station? It’s possible that there is some metadata in the signal that conveys this information, but if that was immediately available, again, the system should have told them.

Finally, there is no feedback whatsoever about the time needed to complete the decryption. It doesn’t do much harm here as it’s pretty fast, but I’m guessing that more complex transmissions might pass the threshold of attention it would become an issue.

What is out there?

This is the first thing Jacks asks once he knows about the encrypted coordinates. And the interface designers thought about that one too, and place a small button next to the coordinate labels. That button leads to another window with the map display but not only that, if you look closely you can see that the button label also changes. While at first it reads MAP, after a few seconds the labels changes to GRID followed later by the number 17. And it keeps looping between those last two.

image03
image07
image01

The changing labels are a way to add more info on the same screen real estate. If Vika happens to know the surroundings of sector 17 she could have told Jack there was nothing there without even looking at the map. In the next sequence we see Vika scrolling around the map view—hopefully it opened right at those coordinates, but even if she’s scrolling around to see if there’s anything of interest there, I’ll note that the location does not have a drop pin to let her re-orient.

Losing the signal

Just as Jack is cutting one of the wires from the repeater to shut down the transmission we get a view of the desktop interface again. The modal window that Vika was using to track and decode the signal suddenly closes. This is a nice use of affordances, as the animation itself shows Vika that the signal was interrupted from the source. A more common trope is a big “no signal” label, so this is nice to see.

image06
After Vika finishes the decryption of the coordinates from the signal, Jacks takes his pliers to cut the wires going from the repeater to the building structure to shut down the transmission.
image02
Jacks decides to shut down the transmission from the repeater. As he does so, the desktop closes the window that Vika was using to track the signal, emphasizing the action with a short sound warning.

The only issue I can see is that in some cases Vika would end up opening the modal window again immediately if she was in the middle of work. The computer should stores the signal in memory and switch automatically from LIVE FEED to CACHE so she could continue.

Mostly useable

So the desktop interface definitely has its issues, but at the same time some few well considered details. The main challenge is its withholding the encryption from Vika. It shouldn’t. On the other hand, the interfaces have some clever information design, such as the space-saving labels and the animation which embodies the facts about the signal.

Bike interfaces

There is one display on the bike to discuss, some audio features, and a whole lot of things missing.

image00

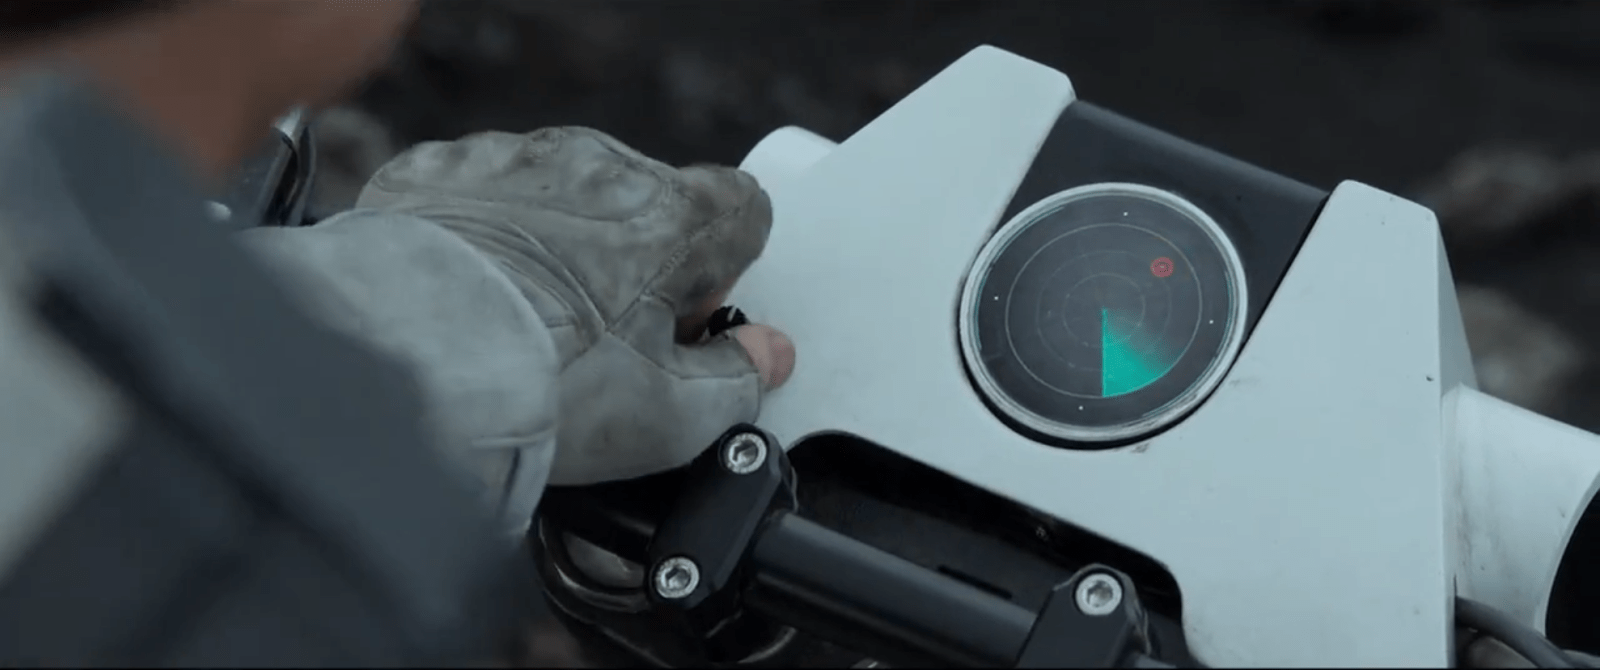
The bike display is a small screen near the front of the handlebars that displays a limited set of information to Jack as he’s riding.  It is seen used as a radar system.  The display is circular, with main content in the middle, a turquoise sweep, and a turquoise ring just inside the bezel. We never see Jack touch the screen, but we do see him work a small, unlabeled knob at the bottom left of the bike’s plates.  It is not obvious what this knob does, but Jack does fiddle with it.

While riding, the bike beeps loud enough for Jack to be able to listen to and understand changes in the screen’s status.  At slower speed and at a stop, the beeping is quieter, as if the bike adjusted the sound level to shout over the wind-noise at speed.  On screen, pulsing red dots representing targets.  After he stops, Jack removes his goggles to look at the screen, but we see him occasionally glance down at the screen while riding with goggles on.  It appears like the radar is legible in either case.

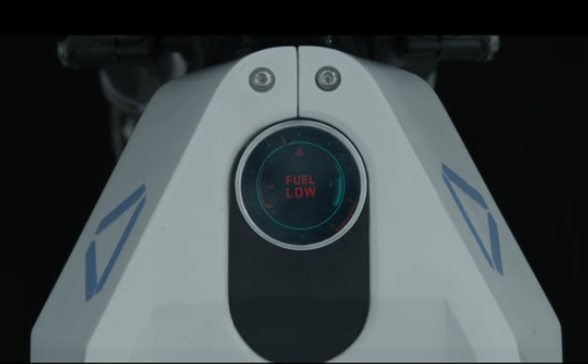
After most of the bike-related events in Oblivion, Jack gets the bike back when it has been ridden.  At one point we see an alternate display that shows large letters that says “Fuel Low”.  At that point the turquoise ring has only a sliver of thickness left.

There are several things that riders of modern motorcycles would expect to be included in a dashboard display, such as a speedometer and temperature gauge. But, we see neither an indication of speed nor some sense of whether the engine is getting too hot.  Similarly, we see no indication of running lights. Where are these things? How are they not needed?

image01

Basically useable…

Yes, the bike’s display shows very basic information that Jack needs for short range exploration and riding.  Jack is able to tell by the loud beeps which direction he should be going, and whether he’s on the right track.  These tones appear to change based on distance to target (hot/cold), with the screen acting as the directional finder.  He only needs to glance down at the display to confirm what the audio feedback is telling him and get a map view of the terrain.

…But is it enough?

This bike would not be road legal today, as it has only the most basic information Jack needs to go exploring: Where to head, and how much fuel he has left. There’s a lot missing.

The most obvious missing piece is the distance to go.  The beacon shows up on orbital scans, so Vika should have an approximate location and distance to go off of.  Jack would then know how long it would take to get there, and whether he had enough fuel for the trip.

He’s also missing a good terrain view in front of him.  On a bike, he isn’t able to traverse just anywhere.  A map and terrain display would let him plan out a route that the bike could handle, instead of guessing and hoping he doesn’t run into a sheer cliff.

Given that Jack is exploring far away from civilization, medical help, the Bubbleship, or even some kind of storage area for first aid or food would be useful.  A bike like this should also have some sort of safety gear.  Jack appears to dislike things like helmets or bulky armor, so the bike should have some indication of built-in safety systems like a deployable, wrap-around airbag.

Given the presence of Scavs, the bike should also have some kind of anti-theft mechanism on it. A lock that only allows Jack to operate the bike, or automatic locking of the wheels would make it difficult for the Scavs to steal it and use the TET technology inside.  Instead, we see that the bike is stolen after Jack descends into the cave, leaving Jack stranded.

To improve the wayfinding, the TET, Vika, or Jack could plot a general course that is relatively safe, fuel efficient, and on the way to the target for the bike.  The bike could then use Jack’s already-present communications system to guide Jack along the route using purely auditory feedback and artificial surround sound (or real surround sound if the earbud is advanced enough).

Why Waste Jack?

Jack is probably expensive in time and material to create, and giving him some protection would save the TET resources.  Even if the TET didn’t care about its crews, it should care about valuable technology that can be used against it.

Aside from the safety factor, which is probably due to the TET’s underlying lack of care about individual Jacks, Jack’s bike is able to navigate him where he needs to go and get him back.  The bike’s radar works even at full speed to point Jack in the right direction thanks to noise-adjusted audio feedback.  Only the addition of some simple anti-theft devices would make the bike more effective for both Jack and the TET.

The bike is not a good example for real-world bikes of the future, but does help set Oblivion in a world where the “employer” doesn’t care about the “employee” beyond their basic ability to get the job done.

Communications with Sally

image01

While Vika and Jack are conducting their missions on the ground, Sally is their main point of contact in orbital TET command. Vika and Sally communicate through a video feed located in the top left corner of the TETVision screen. There is no camera visible in the film, but it is made obvious that Sally can see Vika and at one point Jack as well.

image00

The controls for the communications feed are located in the bottom left corner of the TETVision screen. There are only two controls, one for command and one for Jack. The interaction is pretty standard—tap to enable, tap again to disable. It can be assumed that conferencing is possible, although certain scenes in the film indicate that this has never taken place.

image02

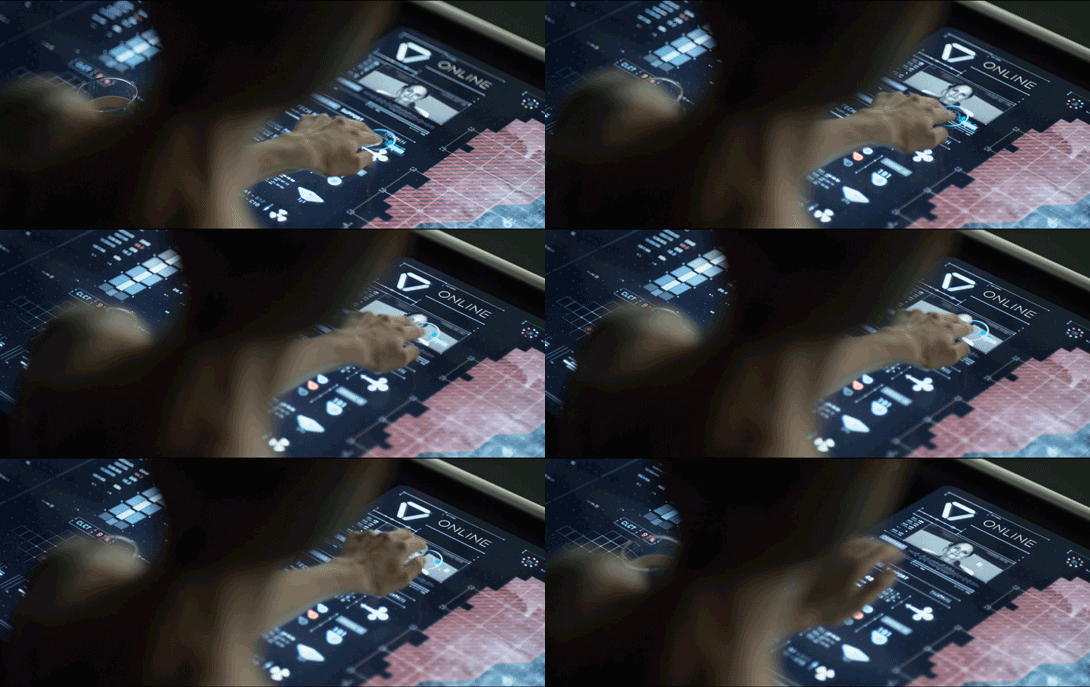
Upon first connecting with Sally each morning, Vika uploads data to the TET by using a two-finger gesture to drag the information up to Sally’s video display. There is no footage showing where she taps to begin the gesture, but it seems to originate at the hydro-rig symbol since Vika is discussing hydro-rig support as she interacts with the screen.

Same interaction for different functions

When Vika sends the hydro-rig coordinates to Jack in the Bubbleship, she is using the exact same interaction as she uses here to send the hydro-rig status data to the TET. When she uses the two-finger gesture to drag from the hydro-rig symbol to the Bubbleship, GPS coordinates are being sent. When she uses the same gesture to drag from the hydro-rig symbol to Sally’s video feed, it sends data on the hydro-rig status. How does the system know what data to send when?

It’s possible that this is another instance of agentive tech in which the system determines what data to send based on where the gesture ends. However, as mentioned in another post, it would be better to use consistent interactions for similar tasks by using the two-finger gesture to upload data to the TET and to use the one-finger gesture for sending coordinates directly with the map interface.

Or better yet, auto-upload the data to the TET upon connection and make it fully agentive. Not great for our heroes’ sense of control, but from the TET’s perspective…

TET communications status

image03

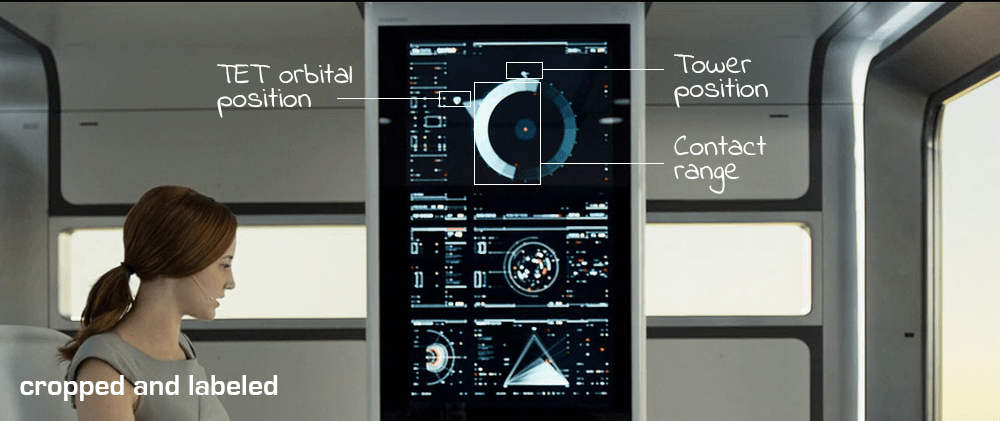
Since Vika relies heavily on the TET’s surveillance and communications capabilities, it is important for her to know when the TET is going to be within contact range. The TET system status feed, which is the screen at the top of the upright section of the desk, monitors the TET’s orbital position in relation to the tower.

As labeled in the image above, the tower position is indicated by an icon located at the top of the circle (the earth) and remains stationary as the TET icon rotates, representing the real-time orbital position. The lighter blue gradient area of the monitor indicates the TET’s range of communications. The darker area indicates when the TET is outside of contact range.

No thinking required

This is one of the simplest interfaces in the film. The visualization of data is very easy to understand and allows for a quick glimpse of all of the information Vika needs without having to think about it. The gradients represent the strength of the signal – the more solid light blue seen directly under the TET symbol indicates a full-strength signal while the darker gradients represent a weaker signal.

One of the main tenets of user experience design is to create technology that would allow anyone, regardless of their technical background, to quickly and easily use the interface with as little mental processing power as possible. Make the design obvious and self-explanatory with no training required.

Don’t make the user have to think about it.