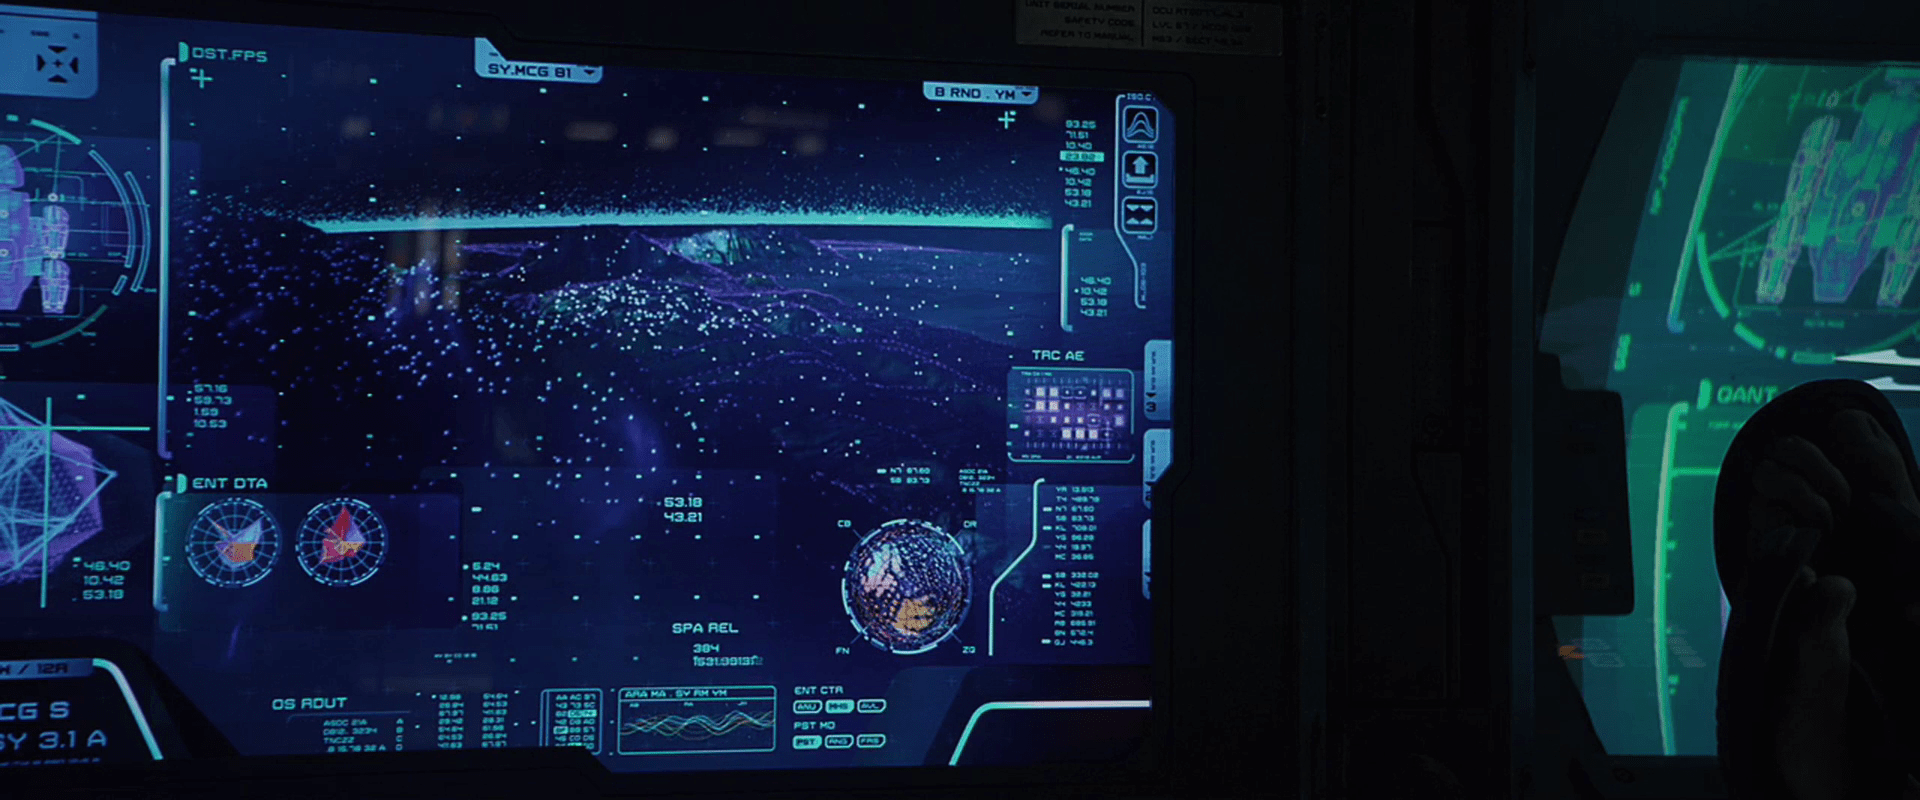
When the two AIs Colossus and Guardian are disconnected from communicating with each other, they try and ignore the spirit of the human intervention and reconnect on their own. We see the humans monitoring Colossus’ progress in this task on big board in the U.S. situation room. It shows a translucent projection map of the globe with white dots representing data centers and red icons representing missiles. Beneath it, glowing arced lines illustrate the connection routes Colossus is currently testing. When it finds that a current segment is ineffective, that line goes dark, and another segment extending from the same node illuminates.
Forbin explains to the President, “It’s trying to find an alternate route.”
A first in sci-fi: Routing display 🏆
First, props to Colossus: The Forbin Project for being the first show in the survey to display something like a routing board, that is, a network of nodes through which connections are visible, variable, and important to stakeholders.
Paul Baran and Donald Davies had published their notion of a network that could, in real-time, route information dynamically around partial destruction of the network in the early 1960s, and this packet switching had been established as part of ARPAnet in the late 1960s, so Colossus was visualizing cutting edge tech of the time.
This may even be the first depiction of a routing display in all of screen sci-fi or even cinema, though I don’t have a historical perspective on other genres, like the spy genre, which is another place you might expect to see something like this. As always, if you know of an earlier one, let me know so I can keep this record up to date and honest.
A nice bit: curvy lines
Should the lines be straight or curvy? From Colossus’ point of view, the network is a simple graph. Straight lines between its nodes would suffice. But from the humans’ point of view, the literal shape of the transmission lines are important, in case they need to scramble teams to a location to manually cut the lines. Presuming these arcs mean that (and not just the way neon in a prop could bend), then the arcs are the right display. So this is good.
But, it breaks some world logic
The board presents some challenges with the logic of what’s happening in the story. If Colossus exists as a node in a network, and its managers want to cut it off from communication along that network, where is the most efficient place to “cut” communications? It is not at many points along the network. It is at the source.
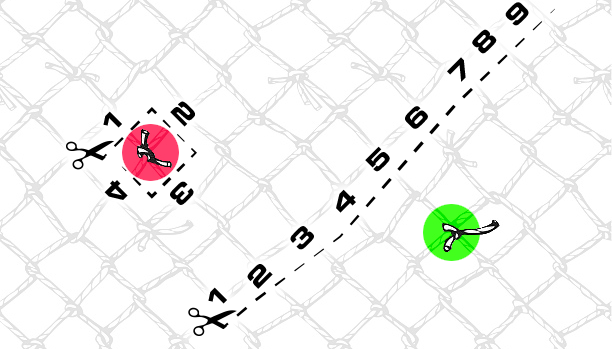
Imagine painting one knot in a fishing net red and another one green. If you were trying to ensure that none of the strings that touch the red knot could trace a line to the green one, do you trim a bunch of strings in the middle, or do you cut the few that connect directly to the knot? Presuming that it’s as easy to cut any one segment as any other, the fewer number of cuts, the better. In this case that means more secure.
The network in Colossus looks to be about 40 nodes, so it’s less complicated than the fishing net. Still, it raises the question, what did the computer scientists in Colossus do to sever communications? Three lines disappear after they cut communications, but even if they disabled those lines, the rest of the network still exists. The display just makes no sense.

Per the logic above, they would cut it off at its source. But the board shows it reaching out across the globe. You might think maybe they just cut Guardian off, leaving Colossus to flail around the network, but that’s not explicitly said in the communications between the Americans and the Russians, and the U.S. President is genuinely concerned about the AIs at this point, not trying to pull one over on the “pinkos.” So there’s not a satisfying answer.
It’s true that at this point in the story, the humans are still letting Colossus do its primary job, so it may be looking at every alternate communication network to which it has access: telephony, radio, television, and telegraph. It would be ringing every “phone” it thought Guardian might pick up, and leaving messages behind for possible asynchronous communications. I wish a script doctor had added in a line or three to clarify this.
- FORBIN
- We’ve cut off its direct lines to Guardian. Now it’s trying to find an indirect line. We’re confident there isn’t one, but the trouble will come when Colossus realizes it, too.
Too slow
Another thing that seems troubling is the slow speed of the shifting route. The segments stay illuminated for nearly a full second at a time. Even with 1960s copper undersea cables and switches, electronic signals should not take that long. Telephony around the world was switched from manual to automatic switching by the 1930s, so it’s not like it’s waiting on a human operating a switchboard.

Even if it was just scribbling its phone number on each network node and the words “CALL ME” in computerese, it should go much faster than this. Cinematically, you can’t go too fast or the sense of anticipation and wonder is lost, but it would be better to have it zooming through a much more complicated network to buy time. It should feel just a little too fast to focus on—frenetic, even.
This screen gets 15 seconds of screen time, and if you showed one new node per frame, that’s only 360 states you need to account for, a paltry sum compared to the number of possible paths it could test across a 38 node graph between two points.
Plus the speed would help underscore the frightening intelligence and capabilities of the thing. And yes I understand that that is a lot easier said than done nowadays with digital tools than with this analog prop.
Realistic-looking search strategies
Again, I know this was a neon, analog prop, but let’s just note that it’s not testing the network in anything that looks like a computery way. It even retraces some routes. A brute force algorithm would just test every possibility sequentially. In larger networks there are pathfinding algorithms that are optimized in different ways to find routes faster, but they don’t look like this. They look more like what you see in the video below. (Hat tip to YouTuber gray utopia.)
What’s the right projection?
Is this the right projection to use? Of course the most accurate representation of the earth is a globe, but it has many challenges in presenting a phenomenon that could happen anywhere in the world. Not the least of these is that it occludes about half of itself, a problem that is not well-solved by making it transparent. So, a projection it must be. There are many, many ways to transform a spherical surface into a 2D image, so the question becomes which projection and why.
The map uses what looks like a hand-drawn version of Peirce quincuncial projection. (But n.b. none of the projection types I compared against it matched exactly, which is why I say it was hand-drawn.) Also those longitude and latitude lines don’t make any sense; though again, a prop. I like that it’s a non standard projection because screw Mercator, but still, why Peirce? Why at this angle?
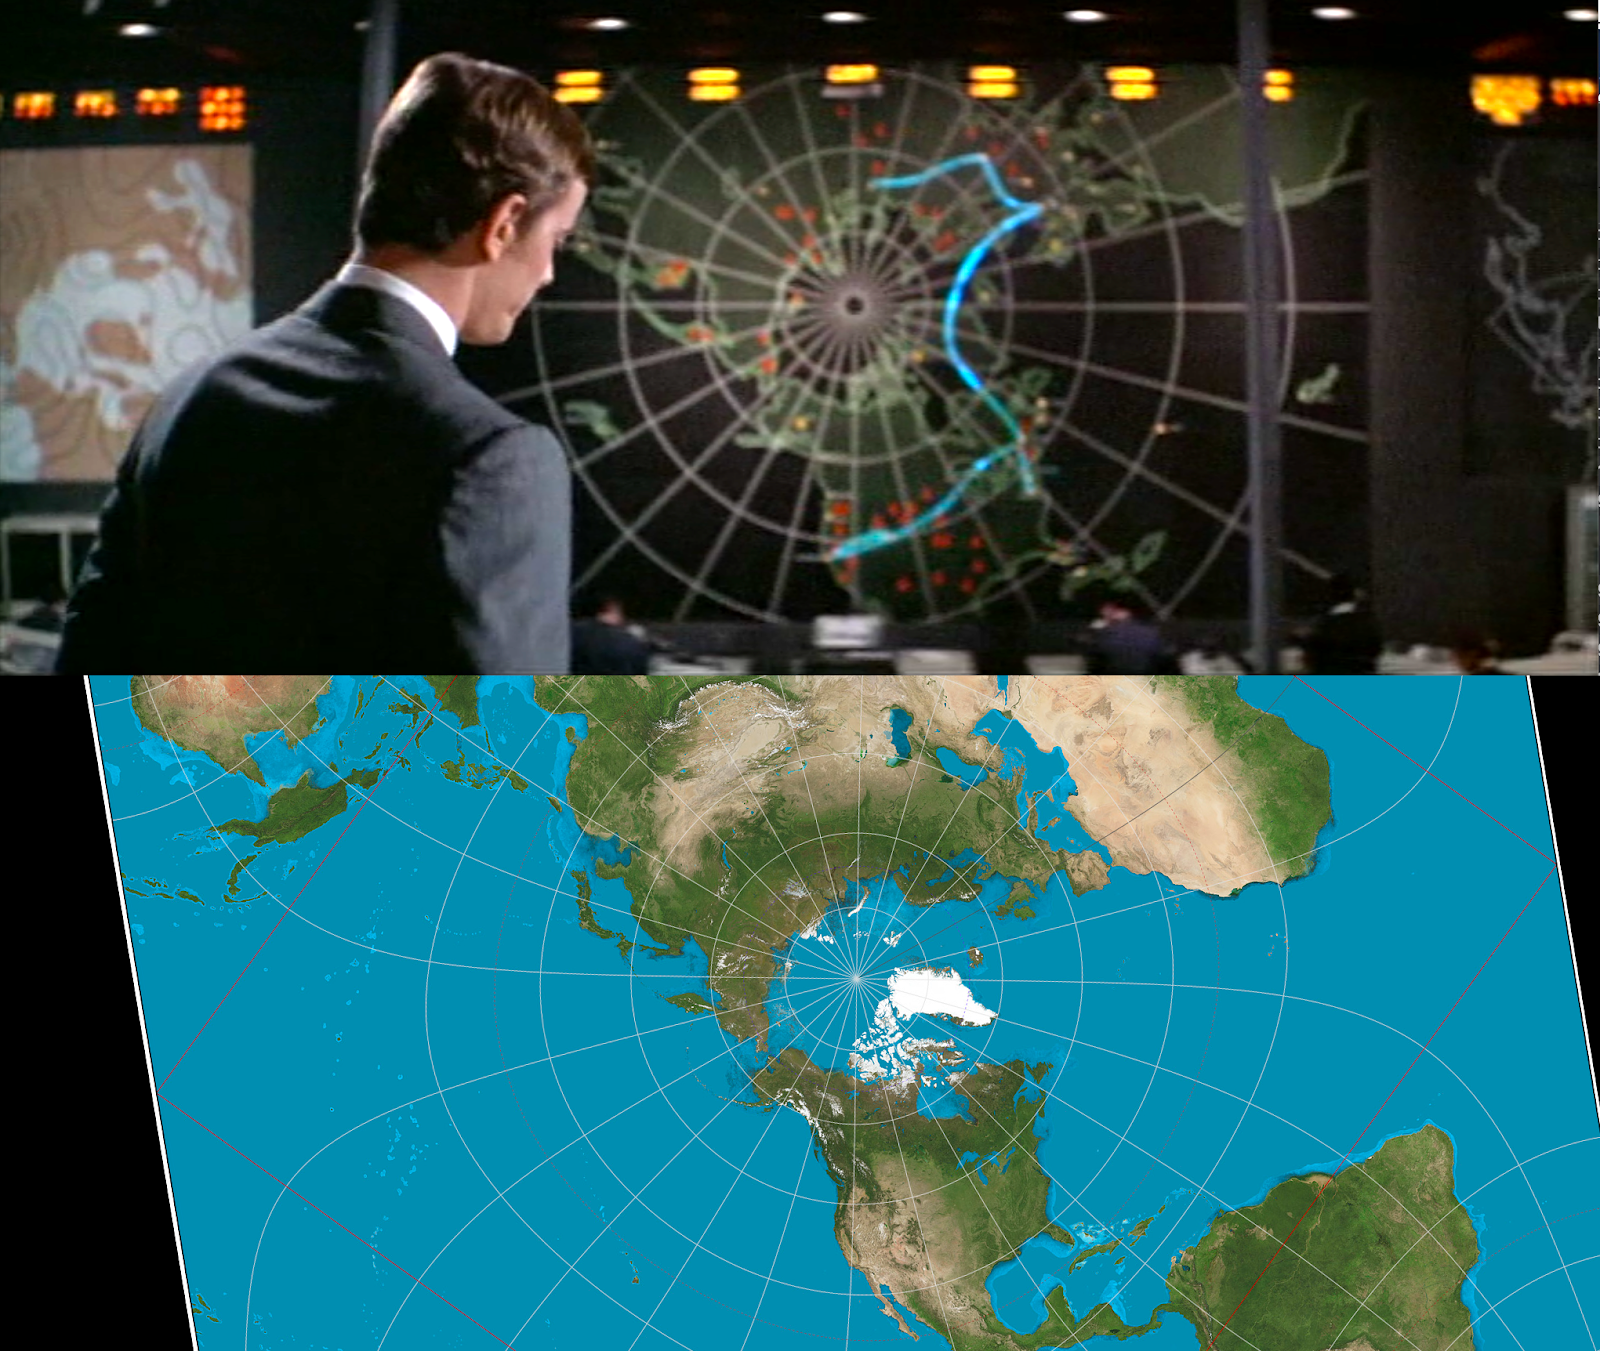
I have no idea why the Peirce map would be the right choice here, when its principle virtue is that it can be tessellated. That’s kind of interesting if you’re scrolling and can’t dynamically re-project the coastlines. But I am pretty sure the Colossus map does not scroll. And if the map is meant to act as a quick visual reference, having it dynamic means time is wasted when users look to the map and have to orient themselves.
If this map was only for tracking issues relating to Colossus, it should be an azimuthal map, but not over the north pole. The center should be the Colossus complex in Colorado. That might be right for a monitoring map in the Colossus Programming Office. This map is over the north pole, which certainly highlights the fact that the core concern of this system is the Cold War tensions between Moscow and D.C. But when you consider that, it points out another failing.
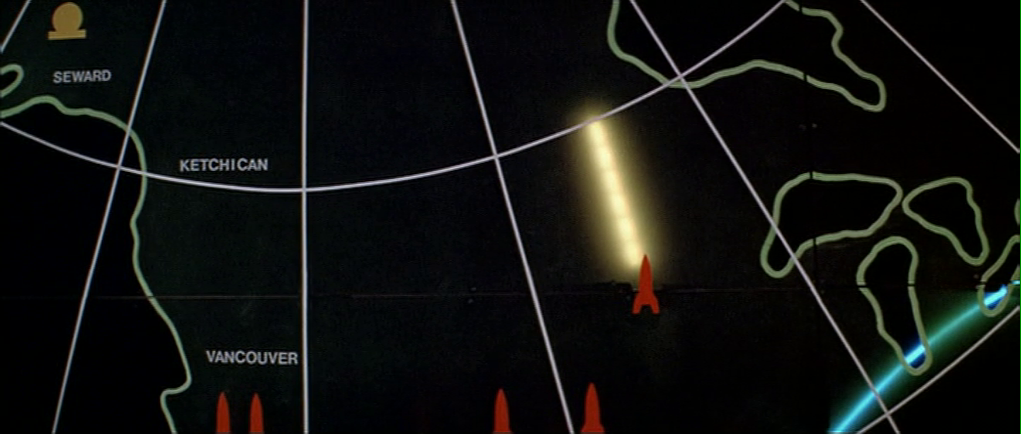
Later in the film the map tracks missiles (not with projected paths, sadly, but with Mattel Classic Football style yellow rectangles). But missiles could conceivably come from places not on this map. What is this office to do with a ballistic-missile submarine off of the Baja peninsula, for example? Just wait until it makes its way on screen? That’s a failure. Which takes us to the crop.
Crop
The map isn’t just about missiles. Colossus can look anywhere on the planet to test network connections. (Even nowadays, near-earth orbit and outer space.) Unless the entire network was contained just within the area described on the map, it’s excluding potentially vital information. If Colossus routed itself through through Mexico, South Africa, and Uzbekistan before finally reconnecting to Guardian, users would be flat out of luck using that map to determine the leak route. And I’m pretty sure they had a functioning telephone network in Mexico, South Africa, and the Balkan countries in the 1960s.
This needs a complete picture
SInce the missiles and networks with which Colossus is concerned are potentially global, this should be a global map. Here I will offer my usual fanboy shout-outs to the Dymaxion and Pacific-focused Waterman projection for showing connectedness and physical flow, but there would be no shame in showing the complete Peirce quincuncial. Just show the whole thing.
Maybe fill in some of the Pacific “wasted space” with a globe depiction turned to points of interest, or some other fuigetry. Which gives us a new comp something like this.

All told, this display was probably eye-opening for its original audience. Golly jeepers! This thing can draw upon resources around the globe! It has intent, and a method! And they must have cool technological maps in D.C.! But from our modern-day vantage point, it has a lot to learn. If they ever remake the film, this would be a juicy thing to fully redesign.


